
Figure 2.
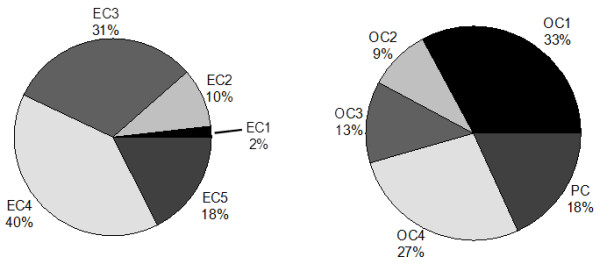
Distribution of EC and OC subfractions during exposures. Concentrations in 8 h samples of subfractions of elemental carbon (EC) and organic carbon (OC) were determined by thermal/optical approaches as described in Materials and Methods.
Official websites use .gov
A
.gov website belongs to an official
government organization in the United States.
Secure .gov websites use HTTPS
A lock (
) or https:// means you've safely
connected to the .gov website. Share sensitive
information only on official, secure websites.
Distribution of EC and OC subfractions during exposures. Concentrations in 8 h samples of subfractions of elemental carbon (EC) and organic carbon (OC) were determined by thermal/optical approaches as described in Materials and Methods.