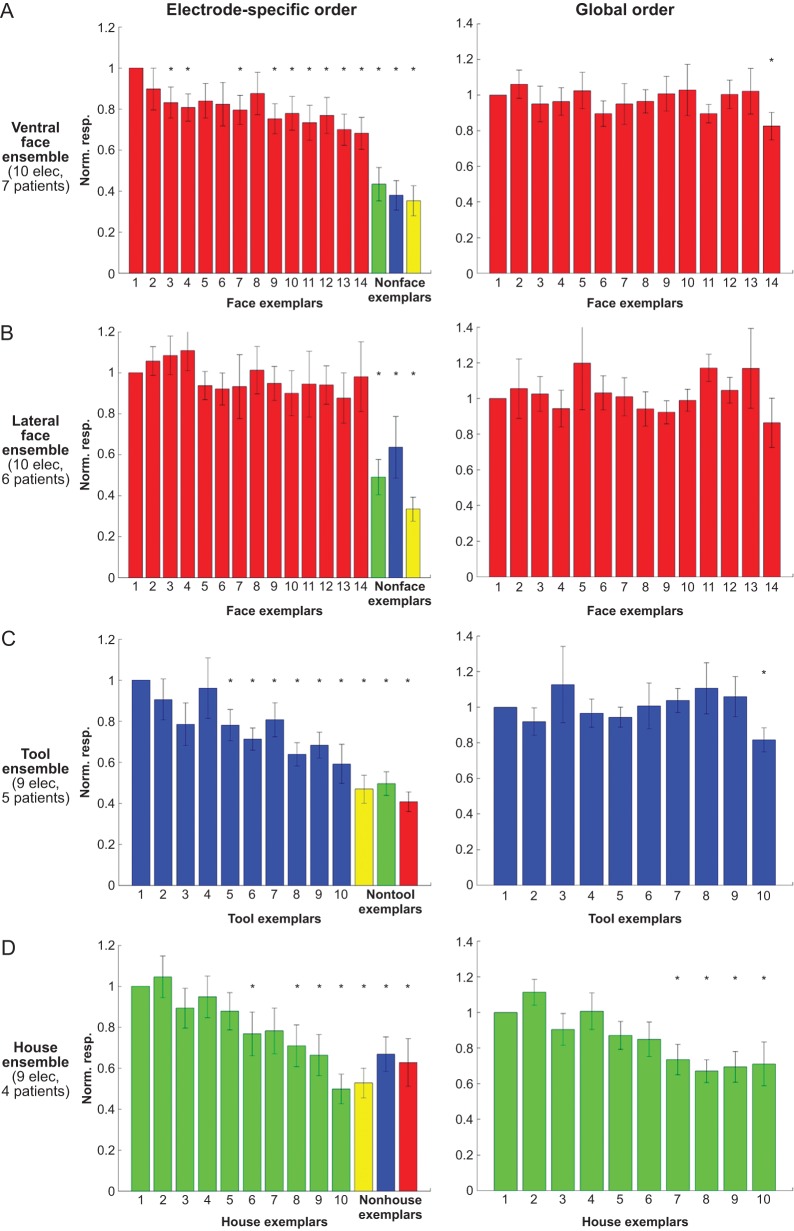
Figure 3.
Grand-averaged exemplar tuning in 10 ventral face-selective electrodes (A), 10 lateral face-selective electrodes (B), 9 tool-selective electrodes (C), and 9 house-selective electrodes (D). Left panel: for each electrode, the exemplars were rank-ordered according to high-Gamma response AUC in even trials (n = 3), and the tuning curve was computed based on the responses in odd trials (n = 3). The procedure was then reversed, this time using the odd trials to order the exemplars and the even trials to plot the responses, and the 2 independent tuning curves were averaged (see also Supplementary Fig. 3). One exemplar from each nonpreferred category that yielded the strongest response is also shown for comparison. The responses were normalized according to the response to the “optimal” exemplar. Same asterisks and error bar notations as in Figure 2B. Right panel: “global tuning”: the exemplars were rank-ordered according to their mean response across the entire electrode population in half of the trials (n = 3), and the tuning curve was computed based on the responses in the other half of trials (n = 3). Note the lack of global tuning, indicating that unlike the electrode-specific order—the global order was not consistent across the 2 datasets.

