
Figure 2.
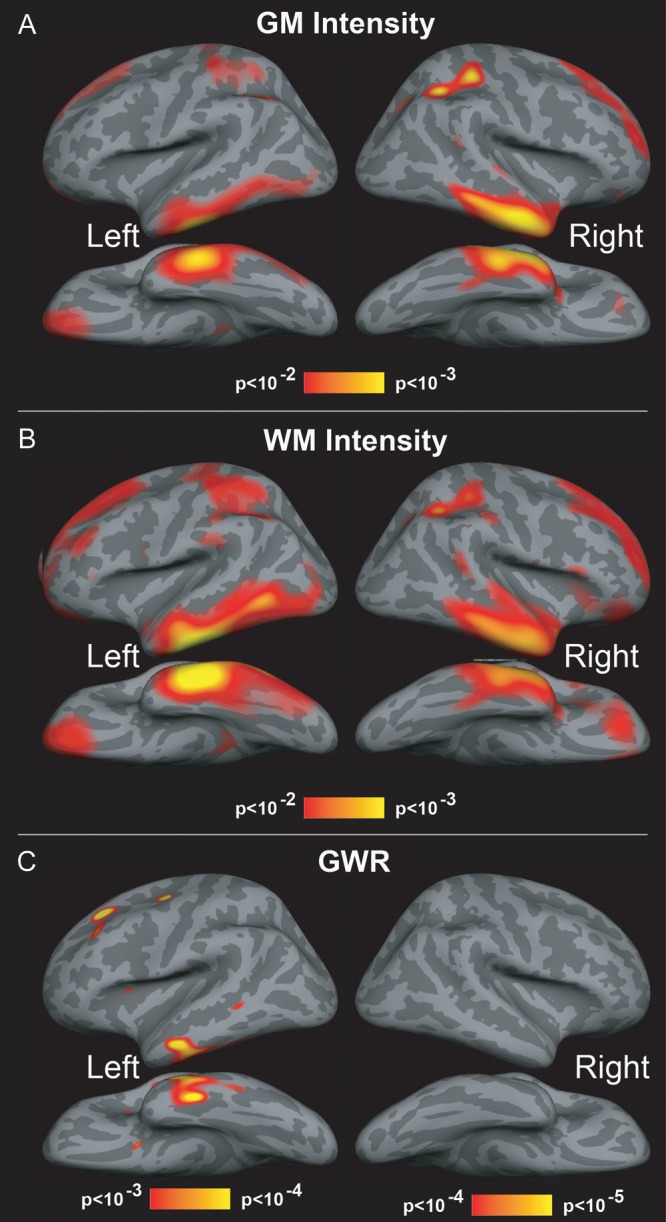
Effects of age of on GM and WM signal intensity, and contrast GWR. Results of GLM analysis displayed on the lateral, medial, and ventral surfaces of the brain. Heated colors (red to yellow) indicate regions where cortical GM and WM intensity and contrast were observed to significantly increase with age. (A,B) Significant effects of age in GM and WM signal intensity are observed bilaterally within lateral and anteroventral temporal regions, as well as dorsal and medial portions of superior frontal cortices and also lateral superior parietal cortices. (C) Contrast is observed to significantly increase with age in anteroventral temporal and dorsal prefrontal regions. Minimal to no changes in contrast are observed within regions of occipital and cingulate cortices. Images are thresholded using at or below 5% FDR criterion.