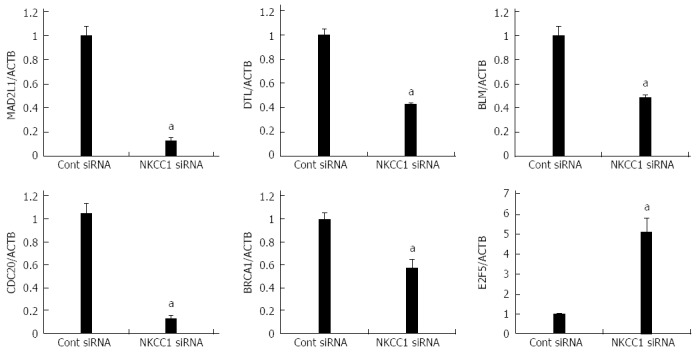
Figure 6.

Verification of gene expression by real-time quantitative reverse transcription-polymerase chain reaction. The expression levels of six selected genes (MAD2L1, DTL, BLM, CDC20, BRCA1, and E2F5) in NKCC1 depleted KYSE170 cells were compared to those in control siRNA transfected cells using real-time quantitative reverse transcription-polymerase chain reaction. Gene expression levels were normalized to the level of ACTB. The mean ± SEM. n = 3. aP < 0.05 vs control siRNA.
