
Figure 3.
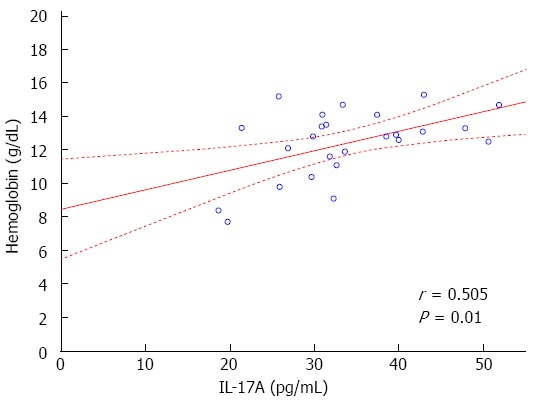
Scatter plot. Scatter plot showing correlation between hemoglobin rate and interleukin 17A (IL-17A) serum levels in Crohn’s disease patients (r = 0.505, P = 0.01).
Official websites use .gov
A
.gov website belongs to an official
government organization in the United States.
Secure .gov websites use HTTPS
A lock (
) or https:// means you've safely
connected to the .gov website. Share sensitive
information only on official, secure websites.
Scatter plot. Scatter plot showing correlation between hemoglobin rate and interleukin 17A (IL-17A) serum levels in Crohn’s disease patients (r = 0.505, P = 0.01).