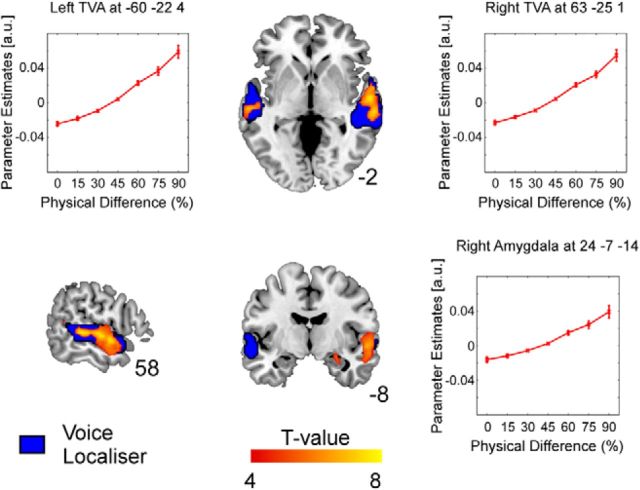
Figure 3.
Activation maps of significant correlations between the physical difference between consecutive stimuli and BOLD signal illustrated on a T1-weighted average structural template. Positive correlations (i.e., increased neuronal adaptation for more similar consecutive stimuli) are evident in areas that overlap with bilateral voice-sensitive cortex (shown in blue) and right amygdala (see also associated plots of parameter estimates in the peak voxels of these clusters).

