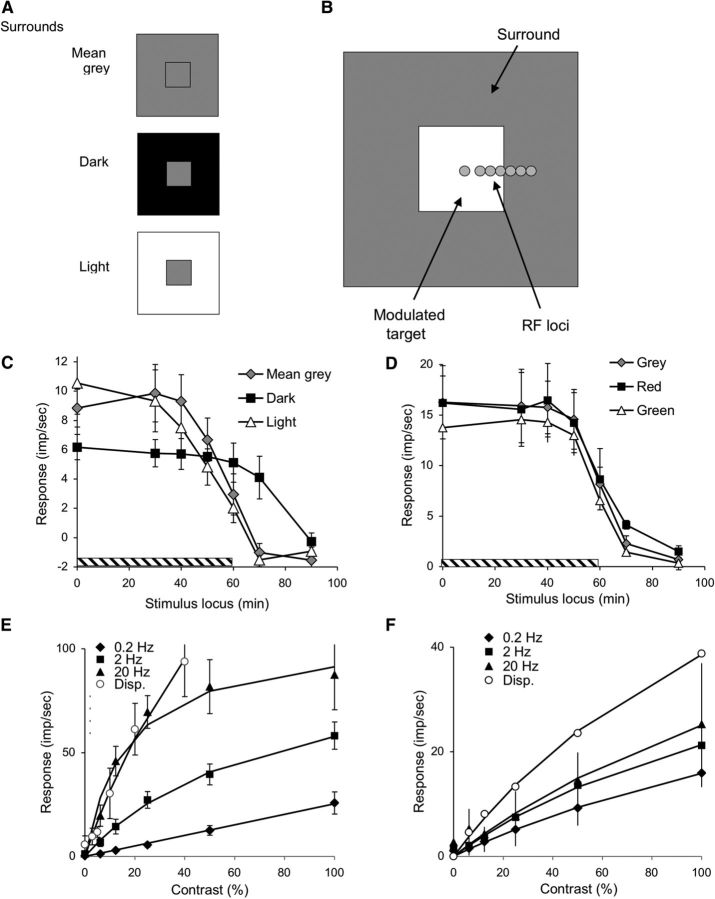
Figure 2.
Spatial configuration of physiological stimulus and responses of RGCs to different contrasts and temporal frequencies at various spatial locations, including abrupt displacements of the stimulus. A, Conditions of the physiology paradigm. Square (2°) targets were set in gray (same mean luminance as target), dark, or light surrounds. B, The pattern (target + surround) was positioned at various loci relative to the RGC RF center (circles). The size of the circles approximately represents the diameter of the parafoveal MC cell center. C, Mean responses ± 1 SD of MC cells (n = 12, On- and Off-center cells combined, 0.2 Hz, 40% contrast, mean of 8 cycles, first harmonic amplitude) as a function of center location relative to target (hatched bar). Responses were weak; and to improve signal-to-noise ratio and look for surround effects, responses were referenced to the response with the target centered on the RF, using a cosine correction. Responses show no indication of edge effects near the edge of the target (i.e., no enhancement of responsivity deriving from lateral inhibitory effects). The response with a gray surround is similar in amplitude to the response with a light surround, and both are 30%–40% larger than with a dark surround, to which responses extended spatially beyond the edge of the target, possibly because of stray light effects. The responses at locations where the RF center is on the steady background while the RF surround is on the modulated target (shown as negative impulses/sec) were very weak and in opposite phase to the center response. These weak responses are compatible with the absence of edge enhancement by MC cells. D, Mean responses ± 1 SD of PC cells to chromatic modulation (n = 5, +L−M and +M−L cells combined, 0.2 Hz, 100% contrast, mean of 8 cycles, first harmonic amplitude) as a function of center location relative to target (hatched bar). Responses were referenced to the response with the target centered on the RF, using a cosine correction. Responses show no indication of edge effects near the edge of the target and are similar under the different conditions. E, Mean responses ± 1 SD of MC cells as a function of contrast at different temporal frequencies of target modulation (n = 5, ∼6–10 s of data acquisition per condition, target centered on RF). Data have been fitted with a Naka–Rushton function (Naka and Rushton, 1967). Open symbols show peak response amplitudes to displacement of a target (at appropriate contrast and phase, 100 ms window) for a cell sample (n = 5). F, Mean responses ± 1 SD of PC cells as a function of contrast at different temporal frequencies of target modulation (n = 4, ∼6–10 s of data acquisition per condition, target centered on RF). Data have again been fitted with a Naka–Rushton function. Open symbols represent peak response amplitudes to displacement of a target (at appropriate contrast and phase, 300 ms window) for a representative +L−M cell.

