
Figure 10.
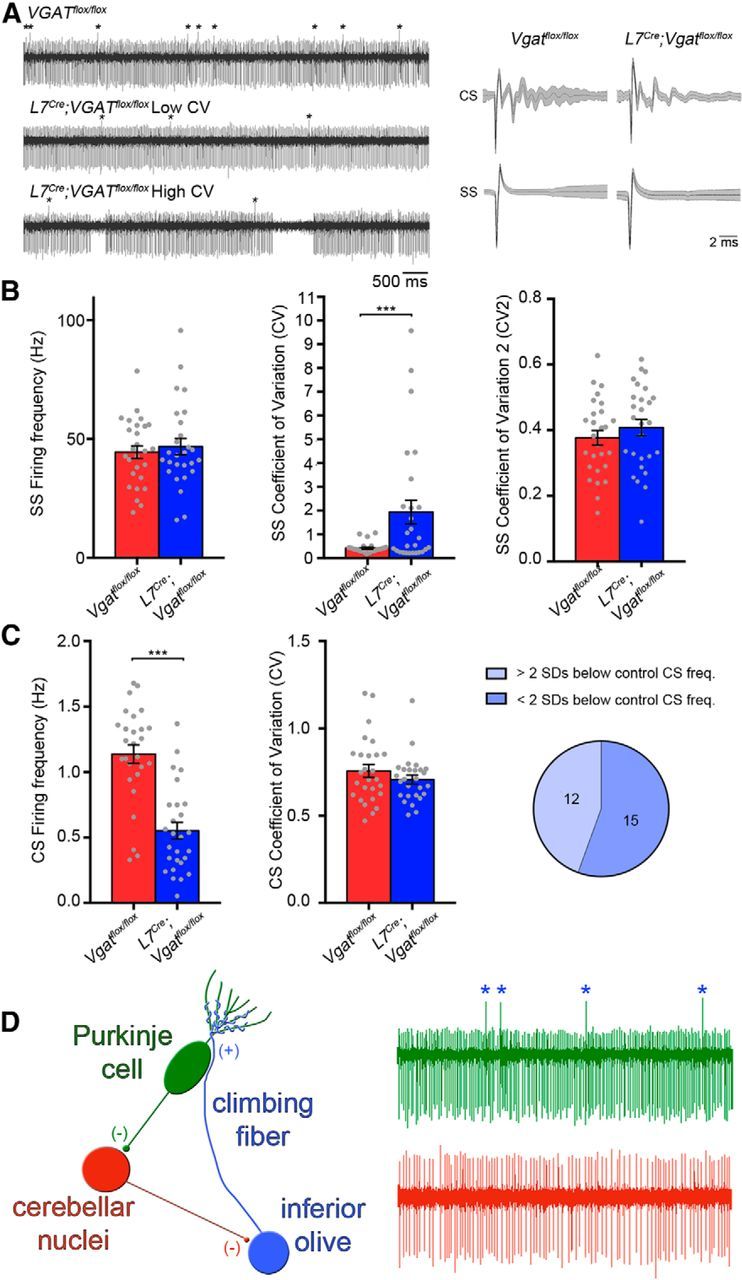
L7Cre;Vgatflox/flox mutant mice exhibit abnormal Purkinje cell activity. A, Sample raw in vivo electrophysiology traces from control and mutant Purkinje cells. Complex spikes(CS) are indicated with asterisks. Right column shows examples of averaged complex and simple spikes (SS) from control and mutant cells, demonstrating the reliability in the Purkinje cell signal for measuring spikes in vivo. B, Quantification of firing frequency, CV, and CV2 of simple spikes. The pie graph shows the percentage of cells either less than or greater than 2 SDs above the control CV. C, Quantification of firing frequency and CV of complex spikes. The pie graph shows the percentage of cells either greater than or less than 2 SDs below the control frequency. D, A schematic of the tri-synaptic loop and the spike waveforms that reflect each cellular component; ***p < 0.001.