
Figure 6.
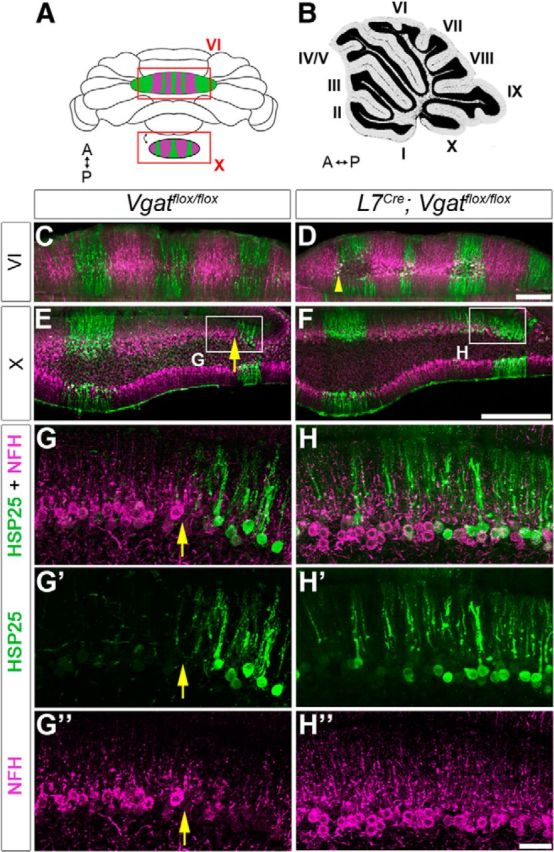
Zonal organization is altered in L7Cre;Vgatflox/flox mice (central and nodular lobules). A, B, Whole-mount (A) and sagittal (B) schematics of the cerebellum. A, anterior; P, posterior. C, E, Coronal tissue sections from a control mouse cut through lobule VI (C) and lobule X (E) and stained with HSP25 (green) and NFH (magenta). D, F, Coronal tissue sections from an L7Cre;Vgatflox/flox mutant mouse cut through lobule VI (D) and lobule X (F). Scale bars: D, F, 200 μm. G, H, Enlarged images from the boxes in E and F. G′, G″, H′, H″, Separated channels for NFH and HSP25 in lobule X. The boundaries of HSP25 zones are poorly defined in the mutant, compared with the obvious boundary in control mice (yellow arrows). Scale bar, 50 μm.