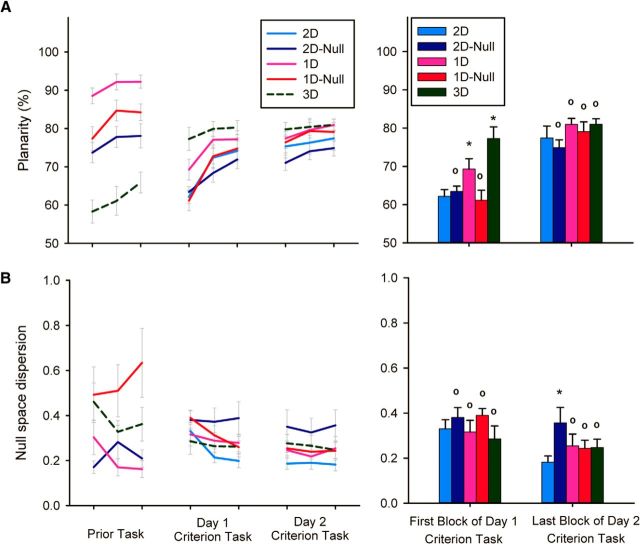
Figure 7.
A, Planarity and (B) null space dispersion of all groups during prior practice and the first 2 d of practice at the criterion task. Right, The bar graph shows the comparison of all groups on the 2D criterion task at first exposure and after 2 d of practice. Error bars represent 1 SE (between-participant). * indicates significantly different from 2D group (p < 0.05), ° indicates not significantly different from 2D group.

