
Figure 4.
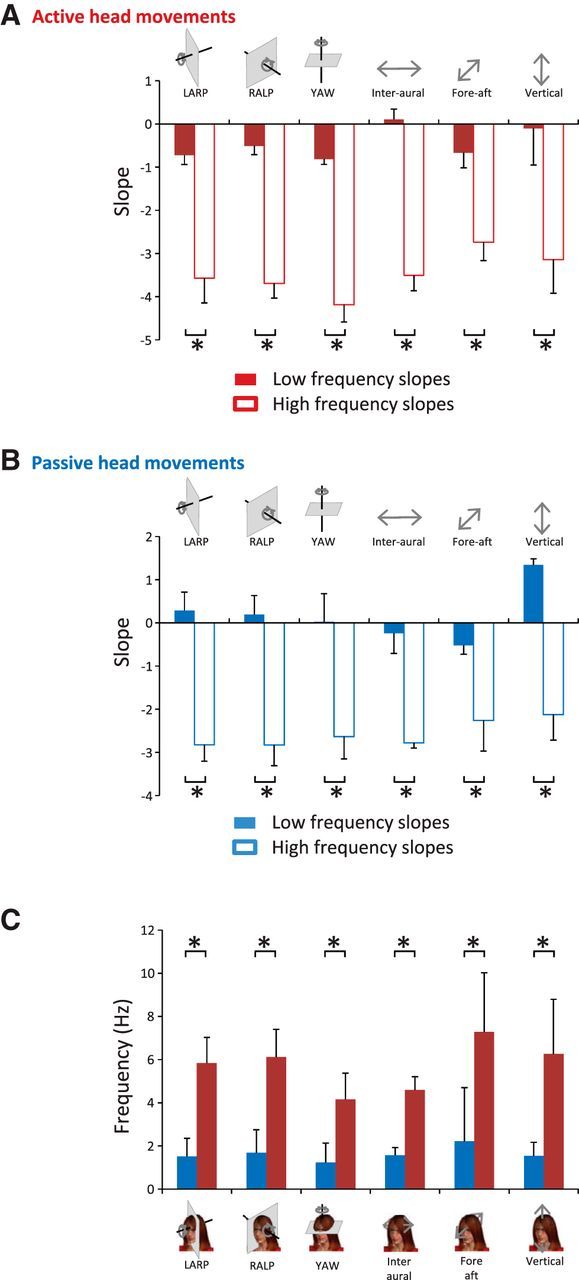
Signals resulting from active motion differ from those resulting from passive motion, although both do not follow a power law. A, Population-averaged slopes obtained for the low-frequency range (solid red bars) were always significantly different from those obtained for the high-frequency range (open red bars) at the p = 0.05 level (*) for active motion. B, Population-averaged slopes obtained for the low-frequency range (solid blue bars) were always significantly different from those obtained for the high-frequency range (open blue bars) at the p = 0.05 level (*) for passive motion. C, Transition frequencies obtained for active motion were significantly different from those obtained for passive motion at the p = 0.05 level (*).