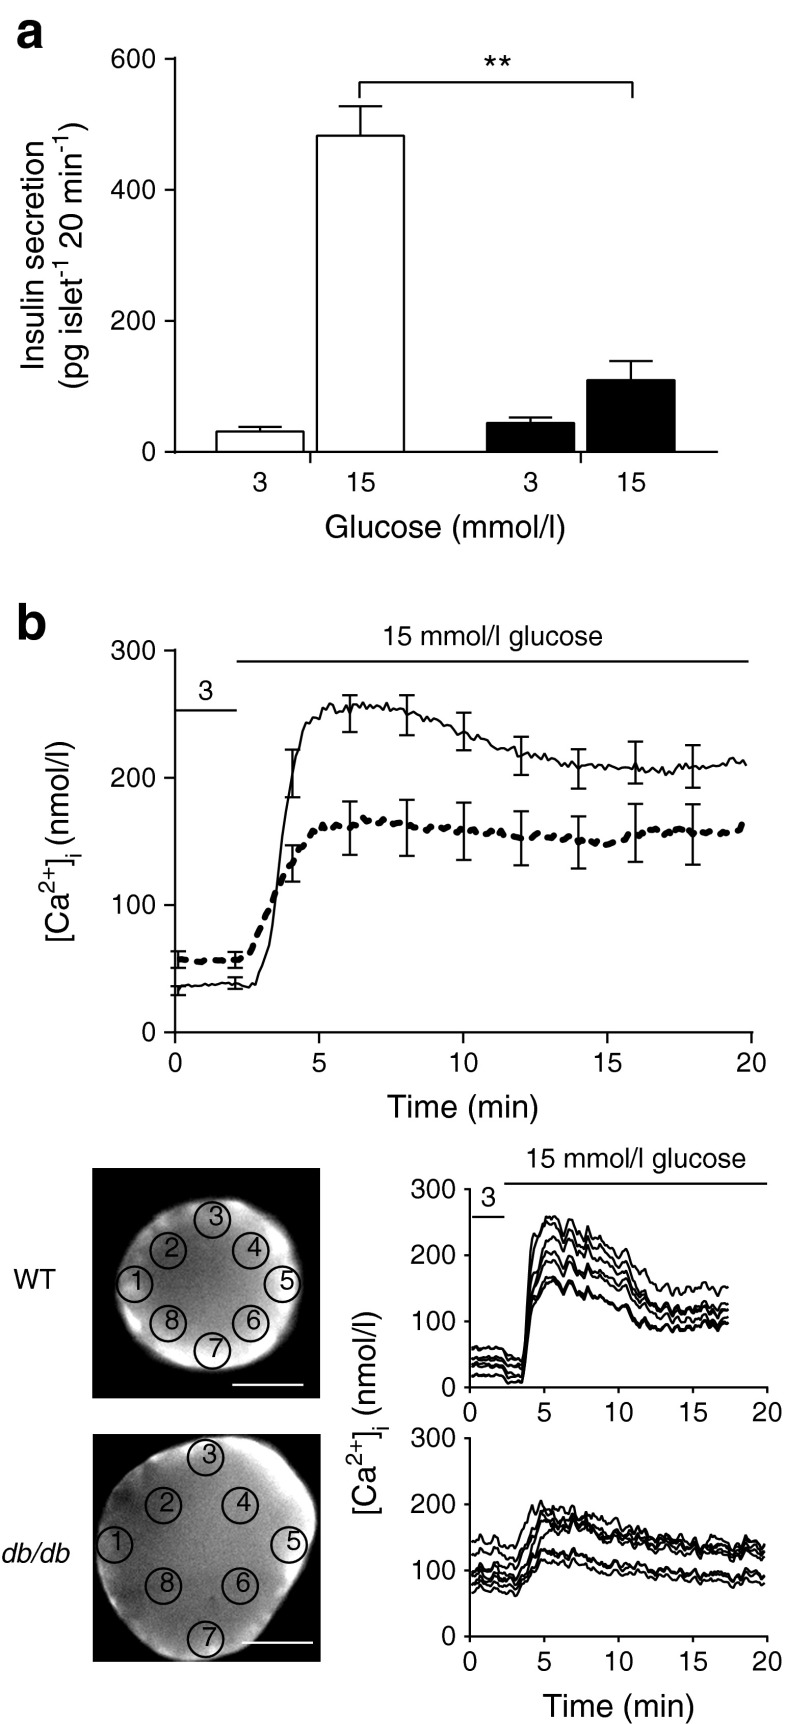
Fig. 1.
Insulin secretion in db/db islets is decreased. (a) A static insulin secretion assay, performed over 20 min, shows that the glucose-dependent increase in insulin secretion in WT islets (white bars) is almost completely lost in db/db islets (black bars), n = 10–12 mice. (b) The calcium response to glucose is smaller and slower in the db/db islets (dotted line) compared with WT islets (solid line) (NB individual data were aligned to the rising phase). For both WT and db/db islets, the calcium response is relatively uniform across individual islets, n = 20–30 islets. Scale bar 50 μm. ** p < 0.01

