
Fig. 2.
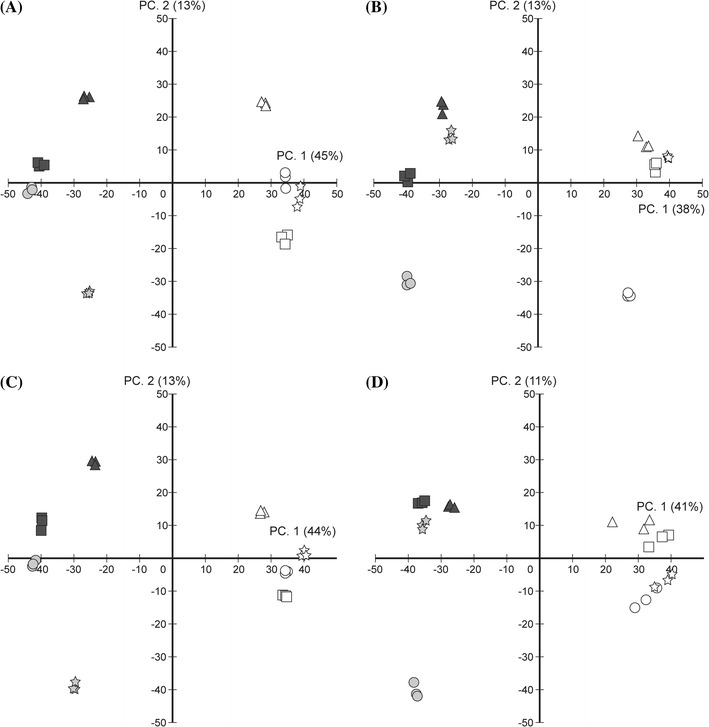
Biplot of Principal Component Analysis (PCA) applied for ESI-FT-ICR/MS. X-axis and Y-axis are principal component 1 (PC1) and principal component 2 (PC2), respectively. Solid circle is the apg2 mutant, unfilled circle is the apg2 Ds donor line, solid square is the apg3 mutant, unfilled square is the apg3 Ds donor line, solid star is the cla1 mutant, unfilled star is cla1 Ds donor line, solid triangle is the ch42 mutant, and unfilled triangle is the ch42 Ds donor line. Gray colored symbol is albino phenotype, black is pale-green phenotype. a Methanol extraction, positive charge mode measurement. b Methanol extraction, negative charge mode measurement. c Acetone extraction, positive charge mode measurement. d Acetone extraction, negative charge mode measurement.