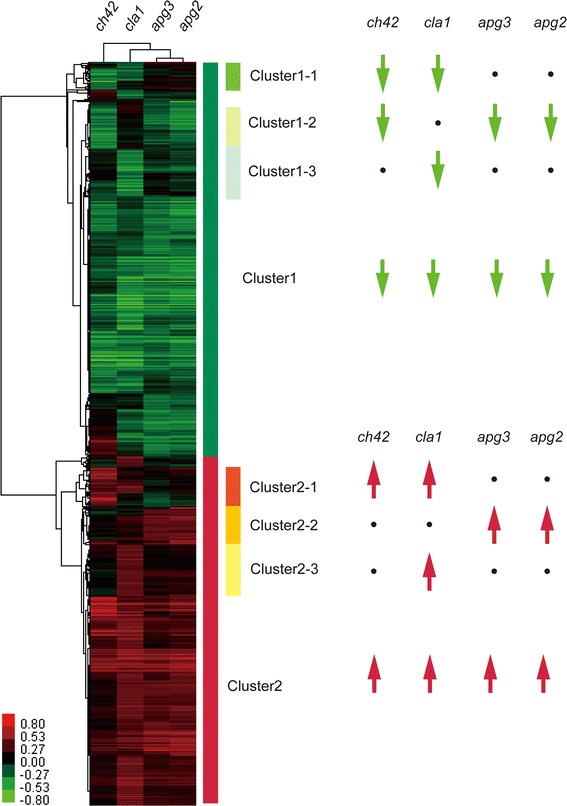
Fig. 3.

GeneTree of Hierarchical Cluster Analysis applied for microarray gene expression profiles. The GeneTree was calculated from 2,812 significantly altered genes (FDR < 1−4). Gene expression in the mutants higher and lower than those of the Ds donor lines are shown in red and green, respectively. Eight clusters were chosen based on their expression and their profiles were displayed as arrow symbols on the right panel. The altered genes were divided between 1,490 up-regulated genes as cluster1, and 1,322 down-regulated genes as cluster2. We extracted three subclusters from each of cluster1 and cluster2. Cluster1-1 (ch42 down-regulated, cla1 down-regulated, apg3 not changed, apg2 not changed), cluster1-2 (ch42 down-regulated, cla1 not changed, apg3 down-regulated, apg2 down-regulated), cluster1-3 (ch42 not changed, cla1 down-regulated, apg3 not changed, apg2 not changed) and cluster2-1 (ch42 up-regulated, cla1 up-regulated, apg3 not changed, apg2 not changed), cluster2-2 (ch42 not changed, cla1 not changed, apg3 up-regulated, apg2 up-regulated), cluster2-3 (ch42 not changed, cla1 up-regulated, apg3 not changed, apg2 not changed) were extracted from the two clusters
