Figure 1.

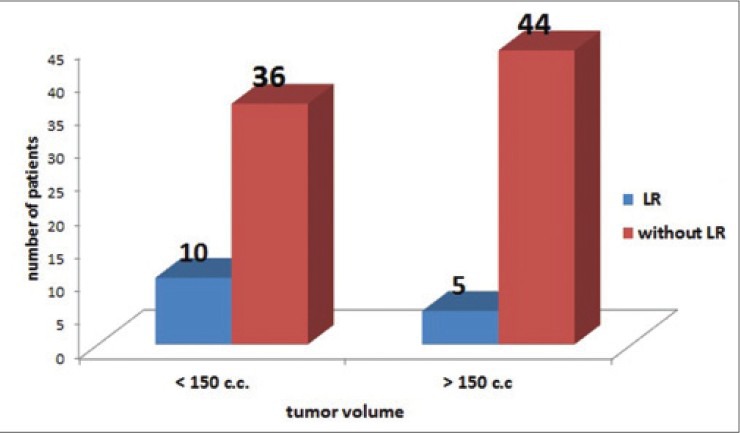
Bar diagram illustrating the relationship between number of patients (with and without local recurrence) and tumor volume in our series

Bar diagram illustrating the relationship between number of patients (with and without local recurrence) and tumor volume in our series