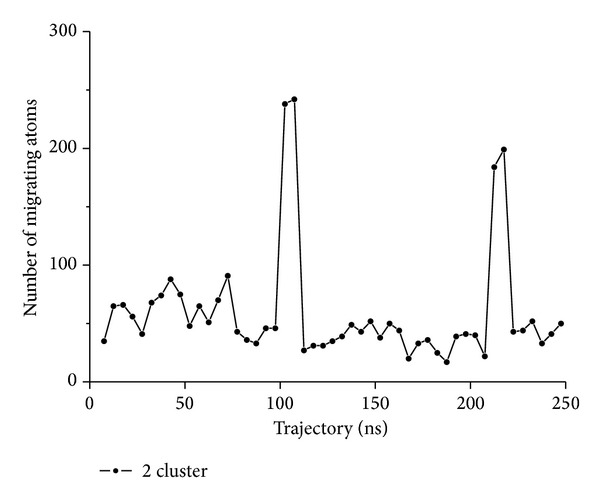
Figure 11.

Migration of atoms between clusters. 50 subset-trajectories have been clustered (example shown for B4402, N clust = 2). After relabelling (according to optimum permutation), the number of migrating atoms with respect to previous clustering is shown. Along this trajectory, two episodes of massive migration occur (around 100 and 220 ns, resp.). However, migrations turn out to be almost reversible; that is, most atoms finally end up in their former clusters (those of sub-trajectory 1), only about 50 (out of 826) do not.
