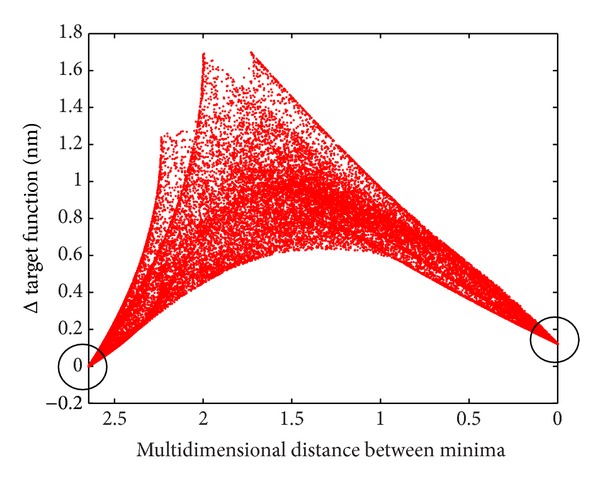
Figure 3.

Topology of target function if a group of 7 atoms is allowed to switch between different clusters. At left and right edge of the graphics ground states are located (black circles), with corresponding values of the target function (reference minima, left somewhat lower than right). For the left state, all 7 switchable atoms are located according to cluster minimum 1, for the right state according to cluster minimum 2. In between, target function values are plotted (as red dots) for all permutations of cluster memberships for the 7 switchable atoms (3 degrees of freedom: 2 + 2 + 3 atoms). Due to the exceedingly high number of permutations, the area is densely filled with dots. Vertical axis: target function [nm] relative to minimum shown at left margin. Horizontal axis: multidimensional Euclidean distance between reference minima.
