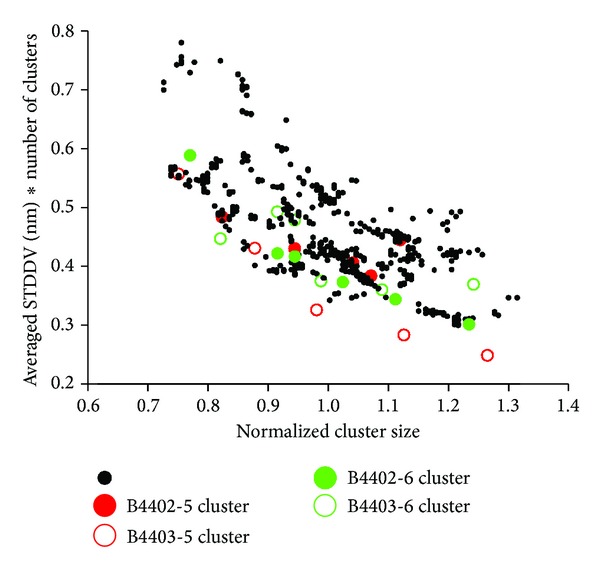
Figure 7.

Rigidity versus size of clusters. Black data point refer to clusterings of two trajectories (B4402, B4403), each split into 50 subsections. For each subsection, clustering was performed twice, for N clust = 5 and 6, yielding 2 · 50 · 2 = 200 runs of clustering and 50 · 2 · (5 + 6) = 1100 data points. Optimum solution for N clust = 5 is shown in red, for N clust = 6 in green (see Figure 5 for 3D visualization of clusters in the protein complexes). Vertical axis: STDDV within clusters was averaged and multiplied by N clust, in order to be comparable. Horizontal axis: normalized cluster size = 1 means that the number of atoms in a cluster exactly matches the average N/N clust.
