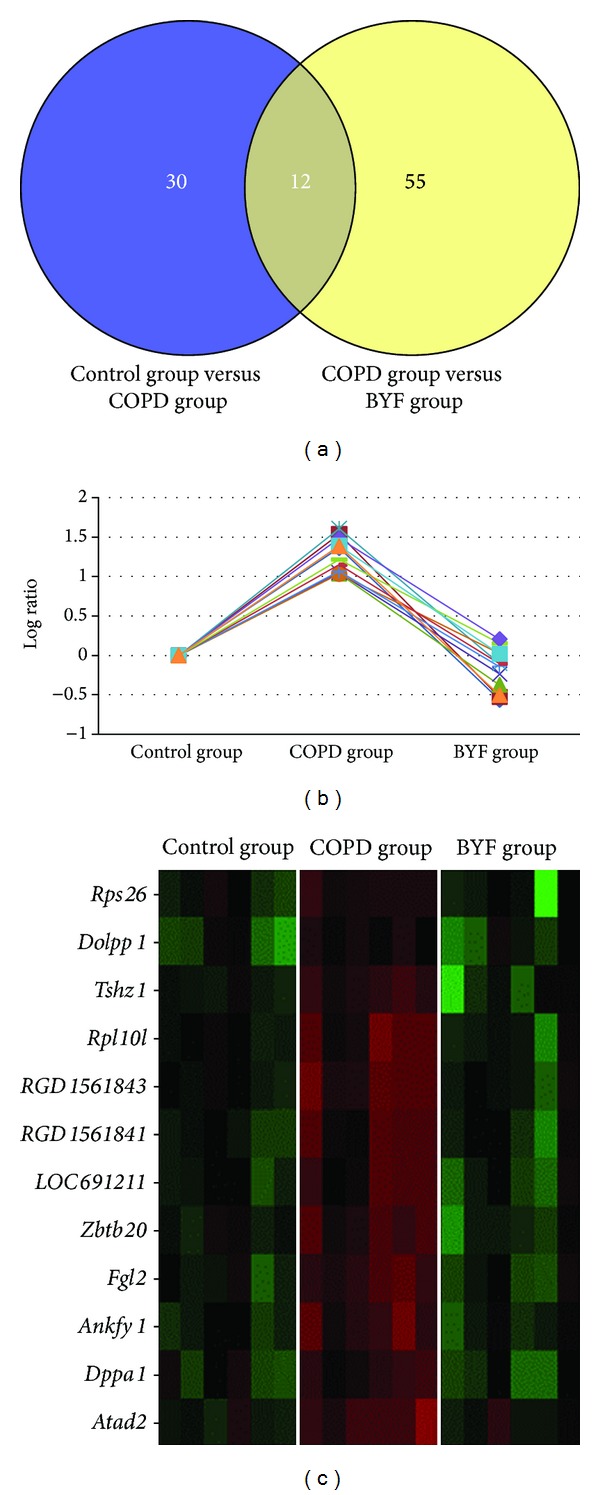
Figure 3.

Venny plot of DEGs between each experimental group and expression of 12 overlapping genes. (a) Venny plot of two DEG lists (COPD versus controls and COPD versus BYF). (b) Expression of 12 overlapping genes from all three rat groups. (b) Gene expression heat map of 12 overlapping genes.
