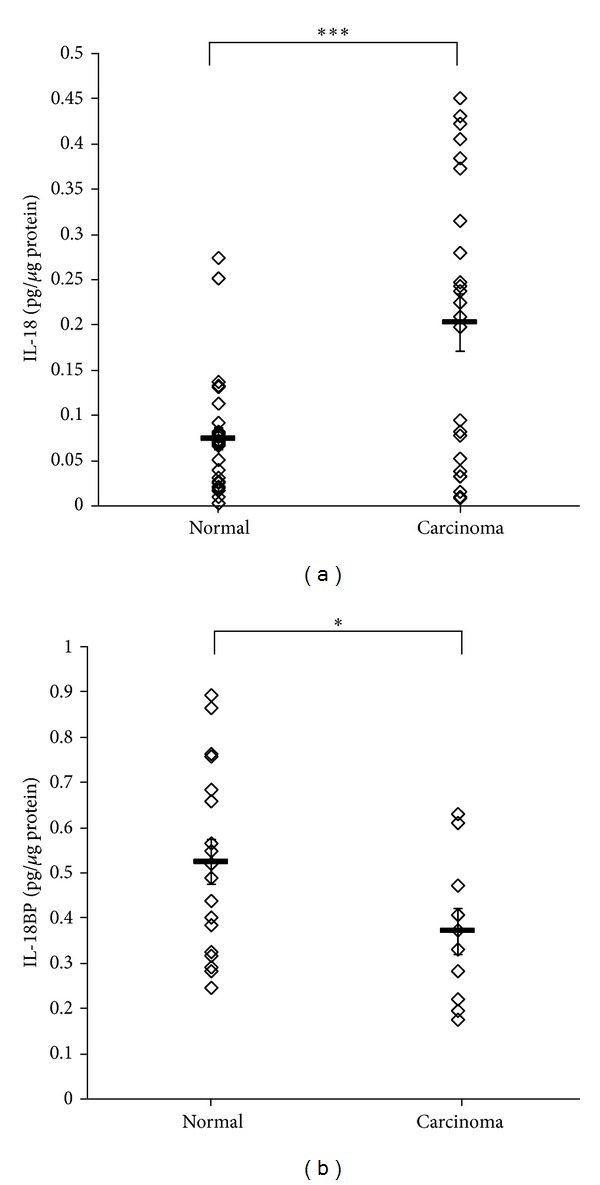
Figure 1.

IL-18 and IL-18BP protein levels in normal and cancerous ovarian tissue homogenates. Normal and cancerous ovarian samples were homogenized. IL-18 (a) and IL-18BP (b) protein levels were evaluated by specific ELISA kits. Levels are expressed as pg/μg protein; each point represents one of the positive samples; n = 28 (normal) and 24 (carcinoma) in (a) and 18 (normal) and 10 (carcinoma) in (b). Horizontal lines indicate MEAN ± SEM. ∗/∗∗∗ indicates statistical significance according to t-test: *P = 0.04; ***P = 0.0007.
