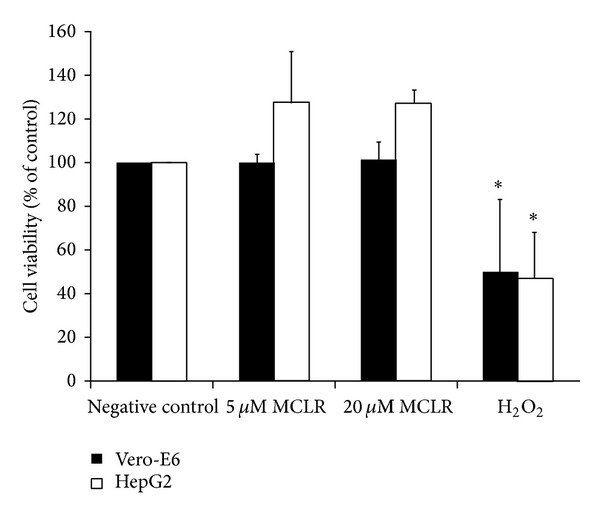
Figure 1.

Viability of Vero-E6 and HepG2 cell lines exposed to MCLR (5 and 20 μM, 24 h) and assessed by the NR assay. H2O2 (400 mM, 1 h) was used as a positive control. Results are expressed as the mean percentage of absorbance values relative to the negative control (±SD) from three independent experiments tested in triplicate. ∗represents a statistically significant difference between the treated and the control cells (P < 0.05).
