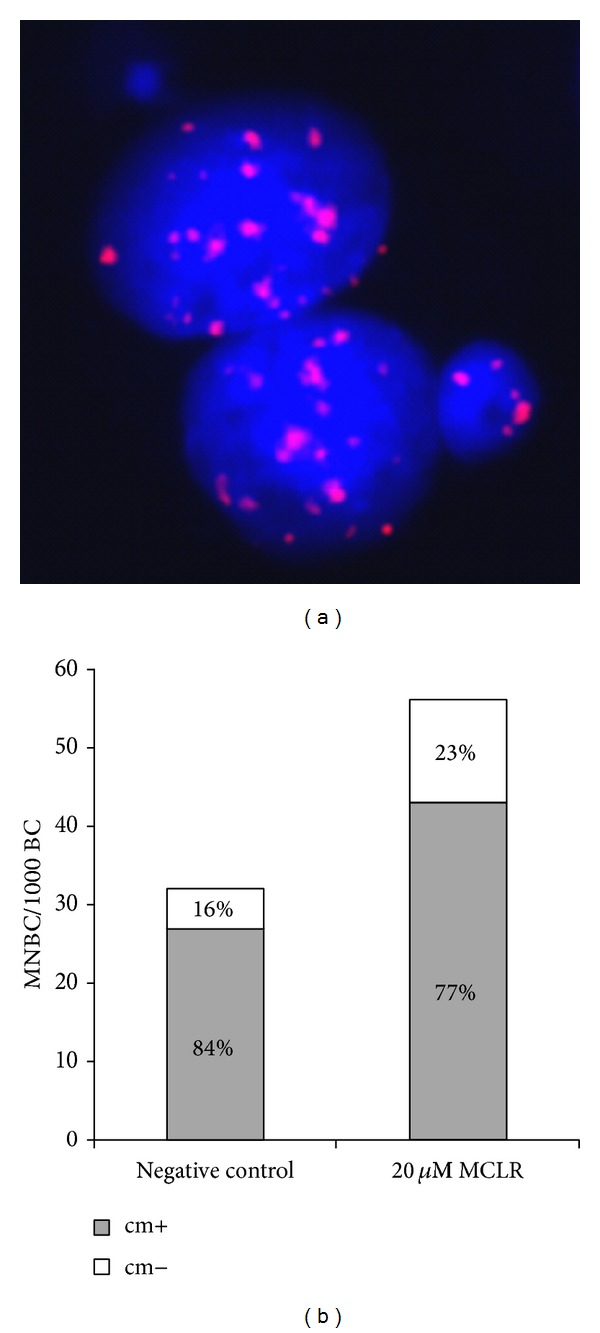
Figure 3.

Characterization of centromere-positive (cm+) and centromere-negative (cm−) micronuclei in untreated and MCLR-treated HepG2 cells (20 μM, 24 h) by FISH analysis using a human pancentromeric probe. (a) A binucleated cell with a cm+ (2 hybridization red signals) and a cm− MN, following MCLR treatment. (b) Absolute and relative frequencies of cm+ and cm− MN per 1000 binucleated (BC) HepG2 cells.
