Figure 2.
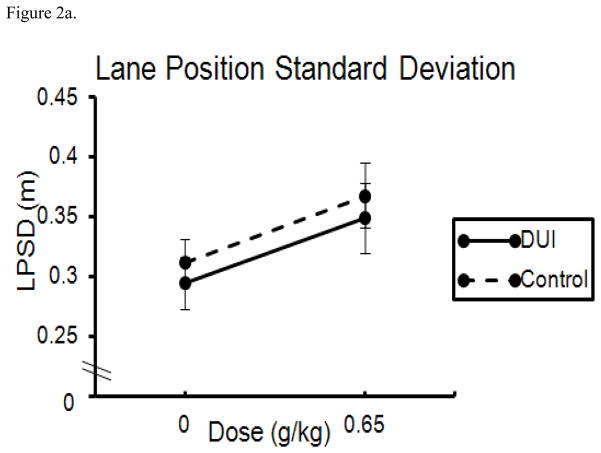
Figure 2a. Mean deviation of lane position (meters) following 0.0 g/kg and 0.65 g/kg alcohol for DUI and control drivers. Error bars indicate standard error of the mean.
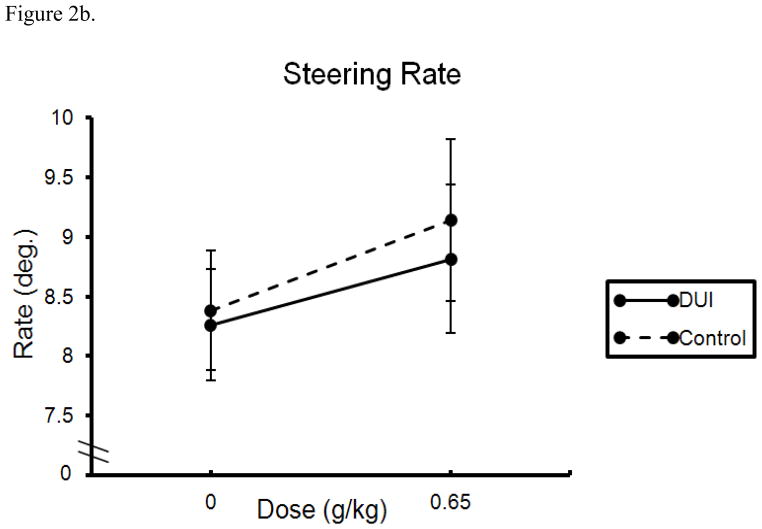
Figure 2b. Mean steering rate in deg/sec following 0.0 g/kg and 0.65 g/kg alcohol for DUI and control drivers. Error bars indicate standard error of the mean.
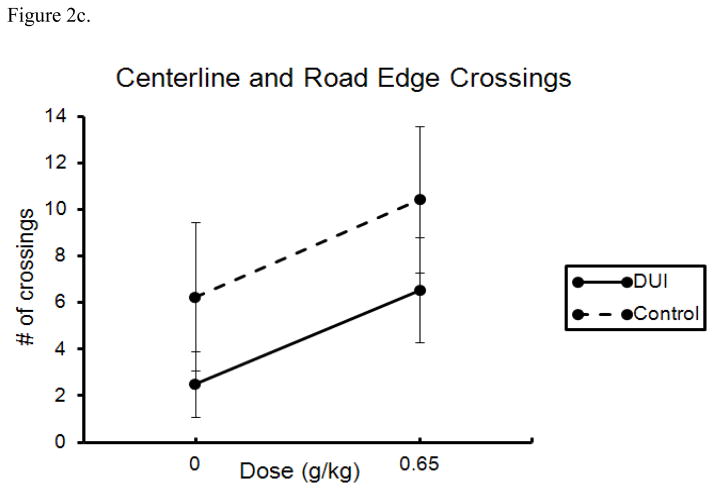
Figure 2c. Mean number of centerline and road edge crossings following 0.0 g/kg and 0.65 g/kg alcohol for DUI and control drivers. Error bars indicate standard error of the mean.
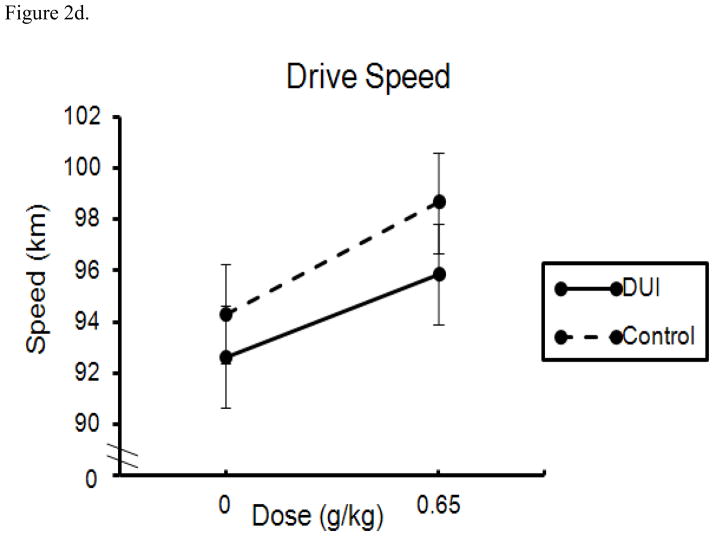
Figure 2d. Mean drive speed (kilometers per hour) following 0.0 g/kg and 0.65 g/kg alcohol for DUI and control drivers. Error bars indicate standard error of the mean.


