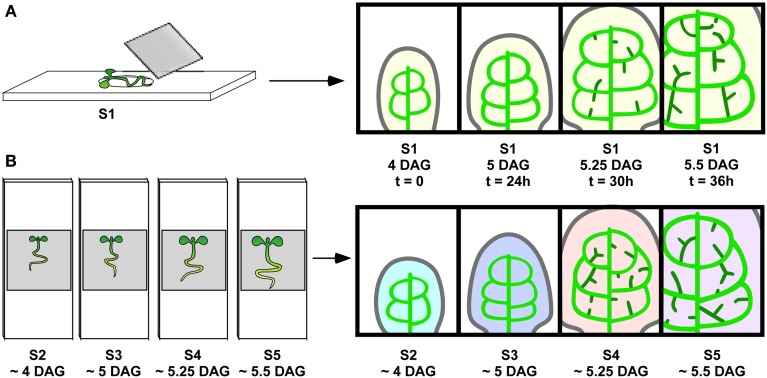
Figure 1.
Live imaging vs. reconstruction of vein ontogeny from staged samples. (A) Live imaging. Sample S1 (left) growing in growth medium on depression slide and put under cover slip for visualization at intervals tested for not interfering with vein development to produce a series of images (right). Since the same veins are visualized repeatedly over time, one can follow the development of the randomly positioned hPEDs. (B) Reconstruction from staged samples. Synchronously grown samples, S2, S3, S4, and S5, are mounted and visualized, resulting in one image per sample (indicated by different colors). This approach is appropriate for vein classes (one, midvein) and (two, second order vein loops), where a reproducible vein pattern allows for the unambiguous identification of each vein across samples.

