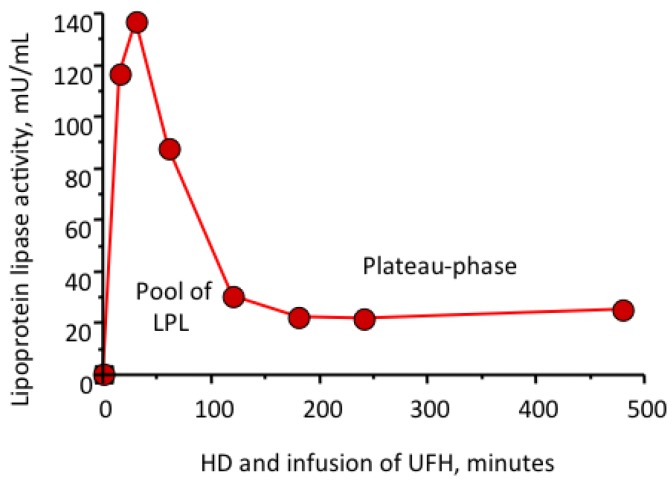
Figure 1.
Plasma lipoprotein lipase distribution in a haemodialysis patient after a bolus and infusion of unfractionated heparin (UFH). The figure shows a peak of lipoprotein lipase (LPL) at 30 min and a reduction despite continuous heparin infusion. The area under the curve from start to 120 min represents the pool of LPL. The following plateau represents the capacity of regeneration of LPL.

