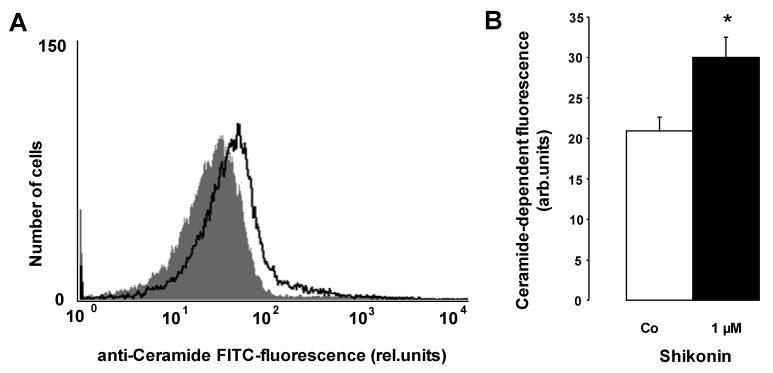
Figure 5.
The effect of Shikonin on ceramide formation. (A) Original histogram of the ceramide surface abundance of erythrocytes following exposure for 48 h to Ringer solution without (grey shadow) and with (black line) the presence of 1 µM Shikonin. (B) Arithmetic means ± SEM (n = 4) of the ceramide abundance after a 48 h incubation in Ringer solution without (white bars) or with 1 µM Shikonin (black bars). * (p < 0.05) indicates significant difference from the absence of Shikonin (t-test).

