
Figure 5.
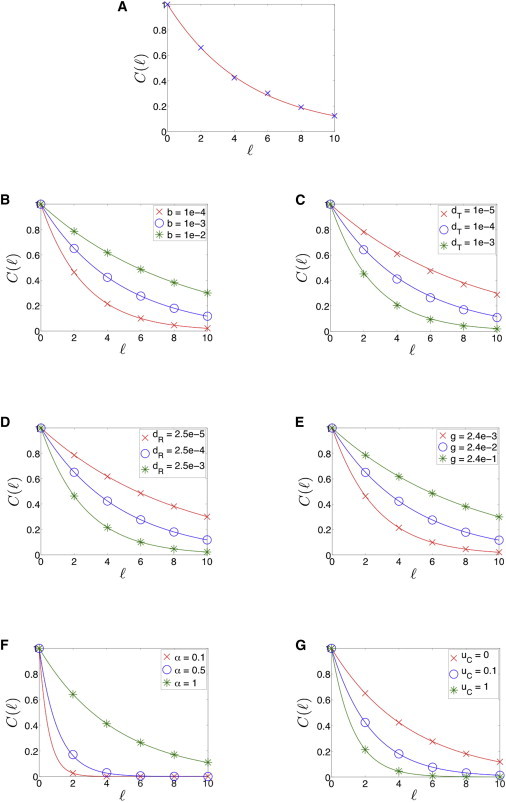
The correlation function decays in a near-exponential form as a function of the distance from the source. (A) Shown are results for a miRNA-target RNA chain in which the parameters are sampled from a suitable Gaussian distribution, located within the biologically relevant range. Parameter values used are reported in Table S1, with respective standard deviations that are each equal to 1/10 of the respective parameter value. The symbols represent the average value of the correlation function, C(ℓ), over 50 instantiations of the parameter values. The curve represents the exponential fit to the data, where ℓ0 = 2.181. (B–G) Symbols represent numerical results and lines represent analytical results. The value of C(ℓ) for RNA components along the chain increases as the miRNA-target binding rate increases (B), target RNA (C) and miRNA (D) degradation rates decrease, RNA generation rate increases (E), stoichiometric factor increases (F), and miRNA-target RNA complex dissociation rate decreases (G). Parameter units for b, dT, dR, g, and uC are s−1. The parameter α is unitless. Parameter values used are reported in Table S1. To see this figure in color, go online.