
Figure 6.
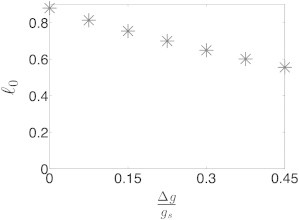
Correlation length versus normalized difference in the generation rates of RNA components. The correlation length increases as the difference between miRNA and RNA generation rates, Δg = gR − gT, decreases, i.e., as the system approaches equimolar equilibrium of all RNA components. The parameter values used in the simulations are reported in Table S1. Here, we kept gR constant and set gT = gR − Δg.