
Figure 8.
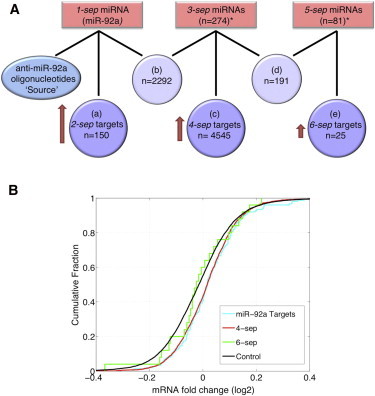
Experimental evidence for distant ceRNAs. (A) A representation of the paths originating from oligonucleotide inhibitors of miR-92a along the miRNA-mRNA human interactome based on the CLASH data (25). To follow the perturbation effect, we classified the target groups: targets (2-sep) of miR-92a (1-sep) (a); shared targets of miR-92a (1-sep) and 3-sep miRNAs (b); targets (4-sep) of the 3-sep miRNAs (c); shared targets of 3-sep and 5-sep miRNAs (d); and targets (6-sep) of 5-sep miRNAs (e). A full list of the miRNAs and targets comprising each of the groups is available in Table S2. In the experiment, miR-92a activity was depleted by the transfection of anti-miR-92a oligonucleotides and the change in expression was measured by microarray. We followed the change in expression of genes in the 2-sep, 4-sep, and 6-sep target groups (a, c, and e, respectively). It was shown that depletion of miR-92a was followed by upregulation of most of its targets (25). The shared targets of miR-92a (1-sep) and 3-sep miRNAs (b) are now expected to be more accessible to the 3-sep miRNAs and attract them, weakening the regulation of the 4-sep targets by 3-sep miRNAs, and thus leading to their upregulation. In turn, the shared targets of 3-sep and 5-sep miRNAs (d) are expected to be more accessible to the 5-sep miRNAs and attract them, weakening the regulation of the 6-sep targets by 5-sep miRNAs and leading to their upregulation. Numbers of miRNAs given in 3-sep and 5-sep groups (starred in the figure) are for total number of miRNAs that share targets with their previous respective miRNA group. The actual numbers of miRNAs considered as regulators of 4-sep targets and 6-sep targets are smaller (264 and 21, respectively), as many targets were removed from the analysis because they were not uniquely targeted by the respective 3-sep/5-sep miRNAs. (B) Cumulative distribution of expression changes after depletion of miR-92a by adding anti-miR-92a oligonucleotides. The log2 fold change of each of the target groups analyzed was compared to a control group of genes not found to be targeted by miRNAs in the CLASH experiment (25). Each of the target groups, the 2-sep targets (miR-92a targets) and the 4-sep targets, were statistically significantly upregulated compared to the control group of nontarget genes (K-S p-values of 5.6 × 10⁻⁴ and 1.93 × 10−72, respectively).