
Figure 4.
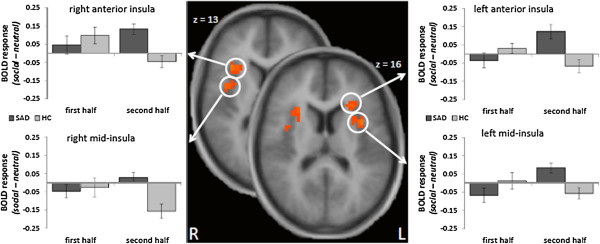
Differential brain activation during the second half of the social vs. neutral video clips. Patients with social anxiety disorder (SAD) displayed enhanced activation within the left and right anterior and mid-insula as compared to healthy control participants (HC; social > neutral video clips). Statistical parametric maps are overlaid on a T1 scan (radiological convention: left = right). The bar graphs show contrasts of parameter estimates (social vs. neutral video clips for first and second half separately; mean ± standard error for maximally activated voxel).