Figure 2.
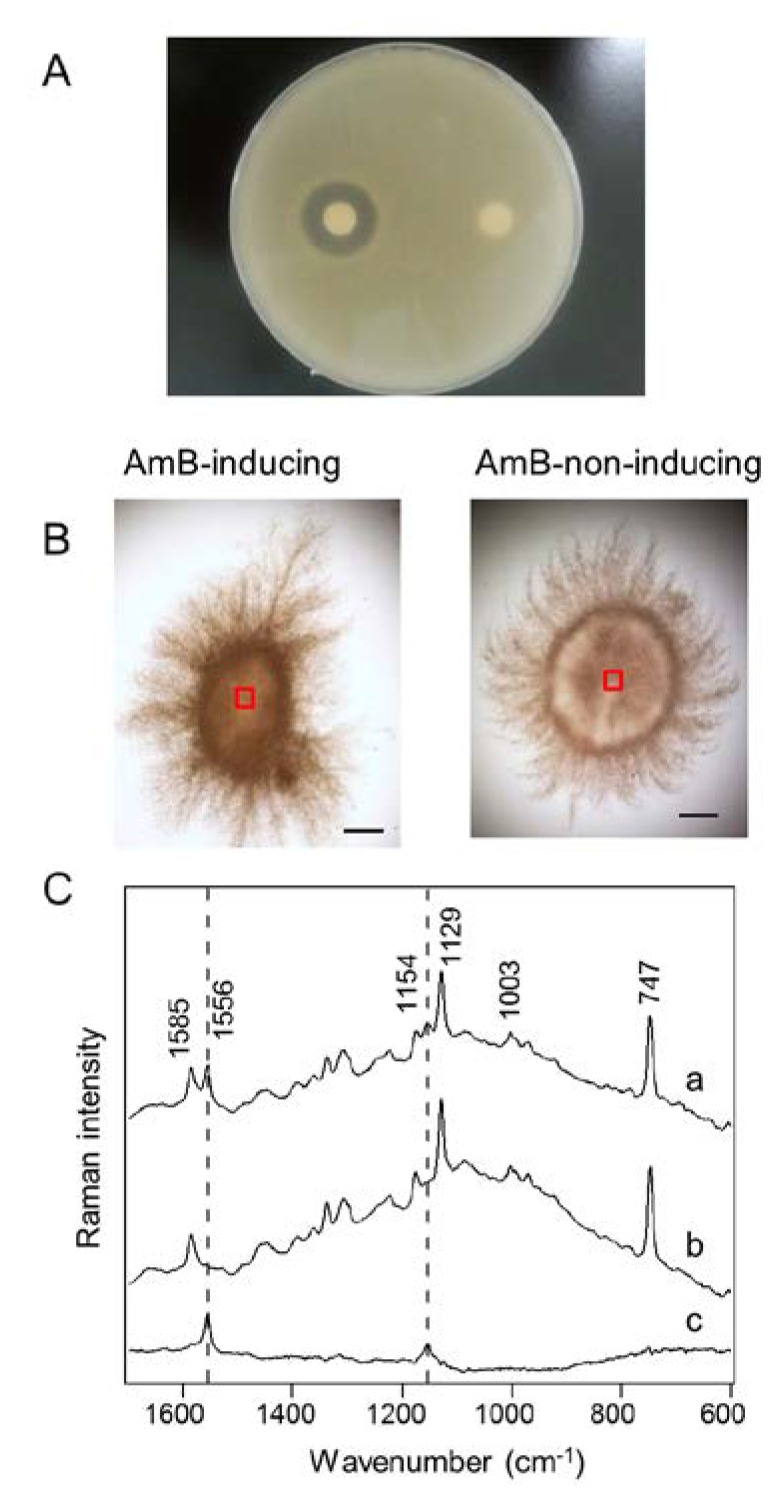
Raman microspectroscopic analysis of S. nodosus mycelia. (A) Evaluation of antifungal activity by the paper disc assay. The paper discs soaked with the extracts of S. nodosus mycelia cultivated under amphotericin B (AmB)-inducing (the left disk) and -non-inducing (the right disk) conditions were placed on an agar plate with Candida albicans; (B) Bright field images of S. nodosus mycelia cultivated in AmB-inducing medium and AmB-non-inducing medium. The Raman spectra were acquired from the areas indicated in the red boxes (30 μm × 30 μm). Scale bar = 200 μm; (C) Raman spectra were obtained from the centers of mycelia. Difference spectrum (c) between inducing (a) and non-inducing (b) conditions was obtained. Dashed lines indicate the AmB-specific bands at 1154 and 1556 cm−1.

