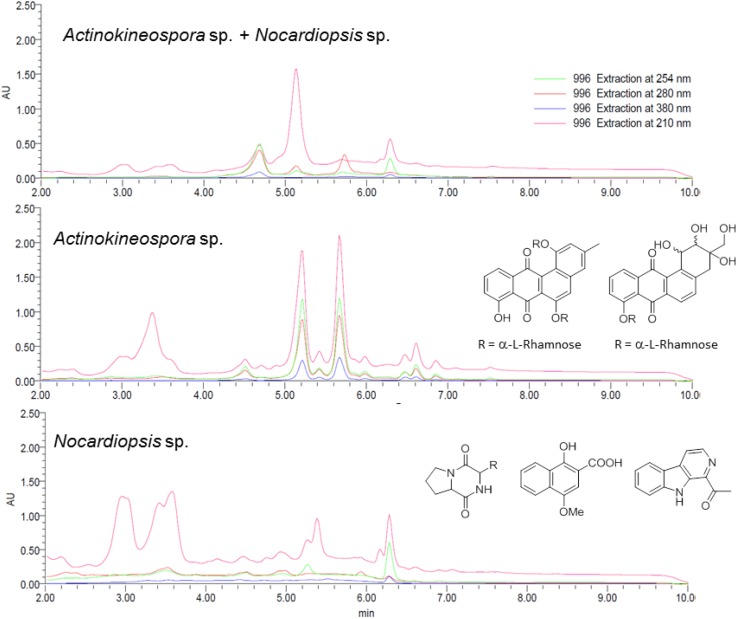
Figure 1.
HPLC chromatograms of the EtOAc extracts of Actinokineospora sp. EG49 and Nocardiopsis sp. RV163 co-culture (top), Actinokineospora sp. EG49 monoculture (middle) and Nocardiopsis sp. RV163 monoculture (bottom). The depicted chromatograms were extracted at 210, 254, 280 and 380 nm, and the bottom two spectra show representative examples of the natural products isolated from the two strains.

