Figure 1.

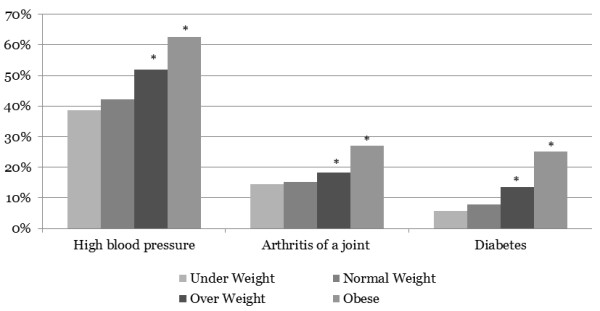
Prevalence of select chronic conditions. Note: Percentages are before adjusting for survey non-response bias and the regression analyses. *Denotes statistically significant at p < 0.01.

Prevalence of select chronic conditions. Note: Percentages are before adjusting for survey non-response bias and the regression analyses. *Denotes statistically significant at p < 0.01.