
Figure 7.
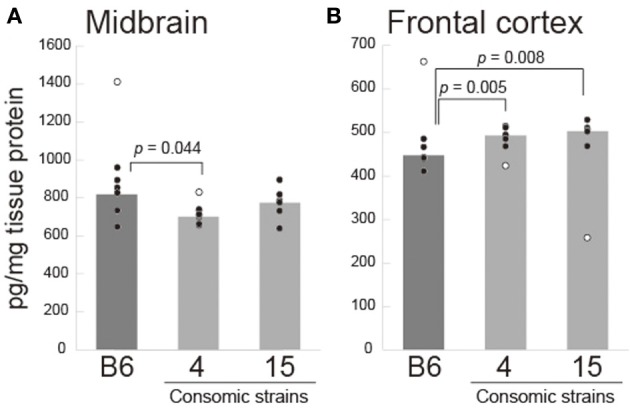
Brain 5-HT content (pg/mg tissue) in the midbrain (A) and prefrontal cortex (B) in B6 and consomic strains of Chr 4 and Chr 15. Each circle indicates each individual's 5-HT content, and open circles indicate outliers that were excluded for statistical analysis. The p-values were calculated by t-test with Bonferroni correction.