
Figure 4.
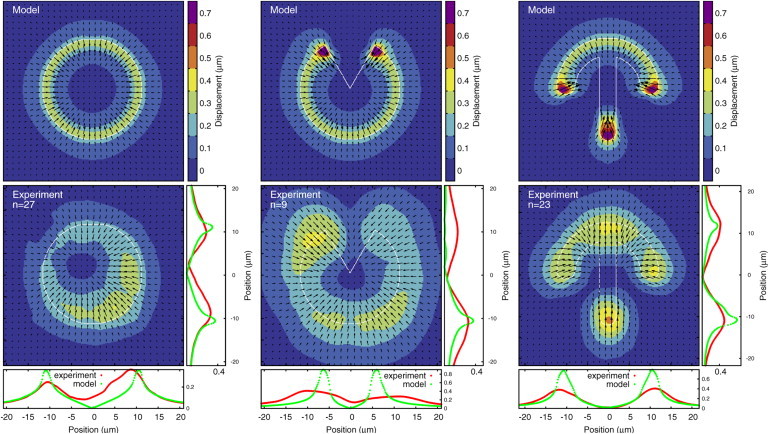
Calculated displacements (upper) and experimental displacements (lower) for MCF10A-cells on fibronectin patterns on a polyacrylamide substrate with a Young modulus of 5 kPa (13). Graphs below and to the right of the experimental displacements are vertical and horizontal one-dimensional slices of the displacement data. The slices always go through the center of the pattern except in the case of the pacman shape, where the horizontal slice goes through the tips. The number of averaged cells is indicated by n for each pattern. Experimental data were kindly provided by Martial Balland. To see this figure in color, go online.