

Abstract
EphA2 is a receptor tyrosine kinase (RTK) that is sensitive to spatial and mechanical aspects of the cell’s microenvironment. Misregulation of EphA2 occurs in many aggressive cancers. Although its juxtacrine signaling geometry (EphA2’s cognate ligand ephrinA1 is expressed on the surface of an apposing cell) provides a mechanism by which the receptor may experience extracellular forces, this also renders the system challenging to decode. By depositing living cells on synthetic supported lipid membranes displaying ephrinA1, we have reconstituted key features of the juxtacrine EphA2-ephrinA1 signaling system while maintaining the ability to perturb the spatial and mechanical properties of the membrane-cell interface with precision. In addition, we developed a trans-endocytosis assay to monitor internalization of ephrinA1 from a supported membrane into the apposing cell using a quantitative three-dimensional fluorescence microscopy assay. Using this experimental platform to mimic a cell-cell junction, we found that the signaling complex is not efficiently internalized when lateral reorganization at the membrane-cell contact sites is physically hindered. This suggests that EphA2-ephrinA1 trans-endocytosis is sensitive to the mechanical properties of a cell’s microenvironment and may have implications in physical aspects of tumor biology.
Introduction
Eph receptor signaling plays an important role in many cell behaviors (1) including vasculogenesis (2,3), axon guidance (4), and cell migration (5). The 16 Eph receptors constitute the largest family of receptor tyrosine kinases (RTKs) (6) and all of them signal in juxtacrine geometry, with the ligands expressed on an apposing cell membrane. EphB receptors preferentially bind to transmembrane ephrinB ligands, whereas the EphA receptors preferentially bind to glycosylphosphatidylinositol (GPI)-anchored ephrinA ligands (7). Misregulation of Eph signaling is linked to a variety of cancers (8,9), with 60–80% of aggressive breast cancers overexpressing EphA2 (10–15). The mechanisms by which EphA2 signaling becomes misregulated are not well understood, due in part to its paradoxical roles: EphA2 has been shown to both promote and suppress tumor progression (13,16). For instance, overexpression of nonmutated EphA2 is sufficient to induce tumorigenesis and metastasis in nontransformed mammary epithelial cells (10), and has been associated with poor patient prognosis (15). Conversely, activation of EphA2 by ephrinA1 attenuates downstream signaling, as measured by phosphorylated levels of Erk (12) and cell migration (17). Specifically, EphA2 is in balance between ligand-dependent and ligand-independent activation (17), and modulating one of these pathways can significantly alter the overall cellular response. There is a growing recognition that many aspects of receptor signal transduction are context dependent (18,19), and some of the enigmas in EphA2 signaling are likely a result of different cellular microenvironments.
Mechanical interactions between cells and their microenvironment are generally thought to be mediated through adhesion molecules: integrins, with the extracellular matrix, and cadherins, with other cells. However, mechanical influences on signaling are not restricted to adhesion. Micron-scale spatial organization and mechanical forces applied to EphA2 were found to alter proximal membrane signaling events, and the degree and strength of EphA2-ephrinA1 clustering varies systematically across a library of cancer cell lines in correlation with severity of the disease (20–22). Thus, physical manipulation of EphA2 alters its signaling properties and the physical association between EphA2 receptors differs markedly between diseased and healthy cells. But precisely how physical forces and spatial assembly of the EphA2 receptor leads to altered signaling activity is not well understood.
Endocytosis is another such adhesion-independent mechanochemically regulated mechanism that in turn can also regulate RTK signaling (23–27), either by physically removing receptors from the cell surface and degrading the proteins (thereby terminating signaling) or by recycling the receptors back to the membrane for sustained signaling. Internalized receptor-ligand complexes that continue signaling from endosomes can even result in an amplified signal (28). Misregulated endocytic trafficking has been implicated in cancer and is an attractive target for therapy (26). Eph signal activation triggers ligand cleavage and shedding from the apposing cell, which results in deadhesion and repulsion, and ultimately receptor internalization (29,30). Several molecular details of Eph endocytosis have been discovered (31–33), although the precise regulation of Eph endocytosis is not well understood. Modulating endocytosis could directly alter the balance between ligand-dependent and ligand-independent EphA2 signaling in cancer cells (17).
To study the cell-cell contact and how juxtacrine signaling is regulated by receptor-ligand movement and large-scale clustering, we have developed a system that interfaces living cells with supported membranes displaying membrane proteins (Fig. 1 A). A key feature of the supported membrane is its lateral fluidity (34,35), which allows the ephrinA1 ligands to diffuse freely in two dimensions and coalesce into large-scale membrane-cell contact regions enriched in EphA2-ephrinA1, effectively mimicking a cell-cell contact. Using this experimental platform removes the complexity of the bidirectional signaling and allows EphA2 forward signaling triggered by membrane-bound ephrinA1 to be exclusively studied with high-resolution fluorescence microscopy. Here, we probe the simplified signaling of membrane-bound ephrinA1. Our assay, however, can easily be adapted to study more complex situations of both ephrinA1 paracrine and juxtacrine signaling by using different fluorescent labels on the soluble versus the membrane-bound ligands. The ephrinA1 construct used here lacks a fluorescent fusion protein (unlike the construct used in (21)) and is biologically active in solution (Fig. S1 in the Supporting Material), corroborating recent studies showing that secreted ephrinA1 is also able to activate EphA2 (36–38).
Figure 1.

Schematic of a cell expressing EphA2 interacting with a supported membrane displaying ephrinA1. (A) When on a fluid membrane cells coalesce ephrinA1 into large regions of high concentration and recruit endocytosis molecules. (B) When membrane-cell contact sites are physically perturbed using chromium diffusion barriers, endocytosis is altered. (C) Bright-field and TIRF images of ephrinA1 at the interface between the cell and supported membrane on an unrestrained substrate and on 10, 5, 3, and 1 μm gridded substrates. Scale bar is 10 μm.
Lithographically fabricated patterns on the underlying glass substrate were used to restrict the microscale diffusion or transport of lipids and proteins in the supported membrane, while maintaining free lateral mobility within such corrals (39) (Fig. 1 B). In turn, EphA2 receptors on the surface of a live cell are subjected to these same physical constraints when they interact with cognate ephrinA1 ligands in the corralled supported membrane (20,21,40,41). Fig. 1 C shows the membrane-cell contact area of breast cancer cells bound to ephrinA1-containing supported membranes on glass substrates patterned with differently sized corrals (1, 3, 5, and 10 μm).
Using this reconstituted juxtacrine signaling platform, we recently reported that ephrinA1 ligands bound to a supported membrane are able to trigger EphA2 receptors in living cells as measured by receptor phosphorylation and degradation (21). Furthermore, we found that EphA2 signaling responds to the spatial and mechanical properties of the cell’s microenvironment (20,22). EphA2-ephrinA1 complexes undergo large-scale actomyosin-driven reorganization at the membrane-cell interface, and physical interference with this movement led to distinct changes in downstream signaling and cellular behavior. In particular, we revealed (20) that frustrating EphA2-ephrinA1 microscale lateral movement resulted in a significant decrease in the recruitment of a disintegrin and metalloprotease 10 (ADAM10). ADAM10 has previously been shown to be important in trans-cleavage of ephrins upon Eph binding (42,43), suggesting that ADAM10 activity might be required for the downregulation of Eph signaling. However, the mechanisms by which the mechanical features of the cellular surroundings are translated into these chemical changes, and how this in turn alters downstream EphA2 signaling, remain obscure.
Here, we report that these large regions at the membrane-cell interface that are enriched in EphA2-ephrinA1 recruit proteins involved in endocytosis (namely clathrin, dynamin, and ADAM10) at the exclusion of many other molecules (Fig. 2). This result prompted us to develop a quantitative single-cell trans-endocytosis assay to probe the effects of EphA2-ephrinA1 reorganization on ligand endocytosis. Using this assay, we found that preventing the large-scale rearrangement and movement of EphA2-ephrinA1 at a cell-cell interface reduces trans-endocytosis of the ligand. Furthermore, we found that the receptor-ligand complex is endocytosed using likely a clathrin mechanism following ligand cleavage from the apposing cell membrane. These results provide mechanistic insight into the spatiomechanical regulation of EphA2 in breast cancer cells.
Figure 2.

Molecular physiology of the EphA2-ephrinA1 contact sites. The ratio of fluorescence intensity within and outside regions of ephrinA1 enrichment is a measure of whether the cellular component is recruited to (values >1) EphA2-ephrinA1 or excluded from (values <1) those sites; values near 1 indicate homogeneous distribution throughout the cell membrane. Clathrin and dynamin are colocalized with ephrinA1, caveolin is antilocalized with ephrinA1, and actin forms a ring around the large EphA2-ephrinA1 contact site. Insets are TIRF microscopy images showing MDAMB231 cells at the membrane-cell interface. The images are false color overlays of ephrinA1 labeled with Alexa Fluor 647 (magenta) and cell components expressed as GFP fusions (green). See Fig. S3 for further details. Scale bar is 10 μm.
Materials and Methods
Protein expression, purification, and labeling
The soluble, monomeric human ephrinA1 (mEA1) sequence (gift of Hans-Christian Asheim, Oslo University, Norway) modified with a C-terminal decahistidine tag (gift of Qian Xu) was cloned into the pFastBac1 (Invitrogen, Carlsbad, CA) expression cassette. The expression cassette was transformed into DH10BacEscherichia coli cells (Invitrogen) and DNA was purified to obtain recombinant viral DNA bacmid. SF9 cells (gift of Ann Fischer, UC Berkeley, CA) were transfected with the bacmid DNA using Cellfectin II (Invitrogen) to generate recombinant baculovirus followed by amplification of viral stocks. SF9 cells were grown in serum-free Sf-900 II SFM insect cell medium and four liters of mid-logarithmic growth phase cells were infected with 50 mL of P2 baculovirus. Cells were centrifuged at 6000 × g and the supernatant containing soluble mEA1-H10 was purified using a gravity flow column containing Ni2+-NTA agarose (Qiagen, Valencia, CA). The mEA1-H10 was then covalently labeled with an Alexa Fluor 647 antibody labeling kit (mEA1-647) per manufacturer’s instructions (Invitrogen).
Supported membrane assembly
Vesicles composed of 98 mol % 1,2-dioleoyl-sn-glycero-3-phosphocholine (DOPC) and 2 mol % of 1,2-dioleoyl-sn-glycero-3-[(N-(5-amino-1-carboxypentyl)iminodiacetic acid) succinyl] (nickel salt) (Ni2+-NTA-DOGS) (Avanti Polar Lipids, Alabaster, AL) were made according to standard procedures (44). Briefly, hydrated lipid vesicles were extruded through a 100 nm membrane 11 times, and then a 30 nm polycarbonate membrane three times using an Avanti Mini-Extruder (Avanti Polar Lipids). Supported membranes were then formed on #1.5 Warner brand 25 mm round coverslips according to standard procedures (44). The supported membrane was then enclosed in an Attofluor cell chamber (Invitrogen). Membranes were blocked with 1 mg/mL casein solution before incubating them with 10 nM mEA1-H10 for 1.5 h according to published methods (45). Excess protein was thoroughly rinsed away and the membranes were then rinsed with HEPES buffered saline (see below) with 10% fetal bovine serum (FBS) (Thermo Scientific, Logan, UT) before the addition of cells. (Other cell media, especially Dulbecco’s modified Eagle’s medium (DMEM) with 10% FBS contained ingredients that significantly interfered with the Ni chelating of the His-tagged ephrinA1, causing the protein to disconnect from the membrane within minutes at 37°C. In HEPES buffered saline with 10% FBS, the His-tagged linkage to the membrane was stable for many hours.)
Grid fabrication
Chromium patterns were fabricated on 25 mm diameter round glass coverslips, which were etched for 5 min in piranha solution (3:1 H2SO4:H2O2), and then spin-coated at 1000 rpm with electron-beam resist (ZEP-520A, Zeon) and conductive polymer (Aquasave, Mitsubishi Rayon). Resist was exposed via electron-beam lithography (CABL9510CC, Crestec). Patterns fabricated included four replicate areas each of 1, 3, 5, 10, and 20 μm grids with line widths of 80 nm. Conductive polymer was removed by rinsing with deionized water, and then resist was developed for 1 min in isoamyl acetate. Chromium with thickness of 7 nm was deposited by electron-beam evaporation (EB3 e-beam evaporator, Edwards). Resist mask was lifted off by sonicating in methylene chloride for 10 min.
Cell culture
MDAMB231 breast-cancer cells (gift of Ann Fischer, UC Berkeley, CA) were cultured in DMEM with Glutamax (Invitrogen) supplemented with 10% FBS (Thermo Scientific). Cells were stripped from culture flasks using Cellstripper (Mediatech, Manassas, VA) and resuspended in 1× HEPES buffered saline (20 mM HEPES, 137 mM NaCl, 5 mM KCl, 0.7 mM Na2HPO4·7H2O, 6 mM D-glucose, 1 mM CaCl2·2H2O, 2 mM MgCl2·6H2O) with 10% FBS for experiments.
Immunostaining, inhibitor, and transferrin experiments
Approximately 300,000 cells were added to each mEA1-647 supported membrane chamber and allowed to engage the membrane for 45 min in a cell culture incubator at 37°C with 5% CO2. Chambers were then rinsed with 5 mLs phosphate buffered saline (PBS) followed by cell fixation with ultrapure 4% paraformaldehyde (Polysciences, Warrington, PA) in 1× PBS for 15 min and finally a 10 mL 1× PBS rinse. For antibody staining, cells were permeabilized with 0.01% Triton X-100 in 1× PBS for 5 min and blocked with 1% bovine serum albumin (BSA) in 1× PBS at 4°C overnight. Mouse monoclonal α-ADAM10 primary antibody (Santa Cruz Biotechnology, Dallas, TX) was added to the cells at a 1:200 dilution in 1% BSA in 1× PBS for 40 min at room temperature. Chambers were rinsed with 10 mL 1% BSA in 1× PBS and a 1:200 dilution of goat α-mouse secondary antibodies conjugated to Alexa Fluor 488 (Invitrogen) was added to the chambers for 20 min at room temperature followed by a 10 mL rinse with 1× PBS.
To inhibit the clathrin terminal domain, cells were stripped from culture flasks using Cellstripper (Mediatech) and resuspended in 1× Tris buffered saline (TBS) with 25 μM Pitstop2 or matching volumes of dimethyl sulphoxide (DMSO) control (Abcam, Cambridge, MA) for 10 min in a cell culture incubator at 37°C with 5% CO2. To completely remove the inhibitor, cells were centrifuged for 3 min at 500 × g, washed with 1× TBS, spun down again, and resuspended in 1× HEPES buffered saline with 10% FBS before adding to the membrane.
To inhibit ADAM10 and ADAM17, 10 μM INCB003619 (Incyte, Wilmington, DE) (or matching volumes of DMSO control) was added to cells in a culture flask for 24 h. Cells were then stripped from culture flasks using Cellstripper (Mediatech) and resuspended in 1× HEPES buffered saline with 10% fetal bovine serum before adding to the membrane.
To monitor transferrin uptake, cells were stripped from culture flasks using Cellstripper (Mediatech) and resuspended in 1× HEPES buffered saline with 10% FBS and 25 μg/mL transferrin conjugated to Alexa Fluor 568 (Invitrogen), immediately before adding to the membrane.
Transfection reagents
For live-cell imaging experiments, cells were seeded in a 6-well plate, allowed to adhere, and rinsed with 1× Dulbecco’s PBS before changing the cell medium to low-serum Opti-MEM (Invitrogen). Following manufacturer’s instructions, cells were transfected for 5–8 h using 10 μL Lipofectamine 2000 (Invitrogen) and 2.5 μg of the following DNA constructs (Table 1):
Table 1.
DNA constructs used
| Construct | Vector | Fluorescent protein | Source |
|---|---|---|---|
| Human clathrin light chain | pN1 | N-terminal TagRFP-T | Dr. David Drubin, UC Berkeley, CA (46) |
| Human dynamin2 | pN1 | N-terminal EGFP | Dr. David Drubin, UC Berkeley, CA (46) |
| Human caveolin1 | pN1 | N-terminal RFP | Dr. David Drubin, UC Berkeley, CA |
| CD52 GPI anchor | pN1 | N-terminal EGFP | Dr. Björn Lillemeier and Dr. Mark Davis, Stanford University, CA |
| KRas anchor | pN1 | N-terminal mCherry | Dr. Nick Endres and Dr. John Kuriyan, UC Berkeley, CA |
| Lck anchor | pN1 | C-terminal mCherry | Dr. Hector Huang and Dr. Jay Groves, UC Berkeley, CA (47) |
| RhoA anchor | pN1 | N-terminal mCherry | Dr. Hector Huang and Dr. Jay Groves, UC Berkeley, CA (47) |
| PLCδ PH domain | pC1 | C-terminal GFP | Dr. Tobias Meyer (48), Addgene plasmid 21179 |
| Mouse cSrc anchor | pN1 | C-terminal mCherry | Dr. Hector Huang and Dr. Jay Groves, UC Berkeley, CA, Addgene plasmid 17685 |
| Mouse cSrc protein | pN1 | C-terminal mCherry | Dr. Hector Huang and Dr. Jay Groves, UC Berkeley, CA, Addgene plasmid 17685 |
| Human utrophin | pcs2 | N-terminal EGFP | Dr. William Bement, University of Wisconsin, WI (49) |
Spinning disk confocal and total internal reflection fluorescence (TIRF) microscopy
All microscopy hardware was controlled with and images were acquired using Micro-Manager (50). Microscopy was performed on a motorized inverted microscope (Nikon Eclipse Ti-E/B, Technical Instruments, Burlingame, CA) equipped with a Nikon 100× Apo TIRF 1.49 NA objective lens, motorized Epi/TIRF illuminator, motorized Intensilight mercury lamp, Perfect Focus system, and a motorized stage (ASI MS-2000, Eugene, OR). Lasers included the following: 200 mW 488 nm Ar-ion laser (Spectra Physics 177G, Santa Clara, CA), 100 mW 561 nm optically pumped solid state laser (Coherent Sapphire, Santa Clara CA), and 100 mW 640 nm diode laser (Coherent Cube, Santa Clara CA). Lasers were controlled using an acoustooptic tunable filter and aligned into a dual-fiber launch custom built by Solamere (Salt Lake City, UT): one single-mode polarization maintaining fiber (Oz Optics, Ottawa, Canada) was connected to a TIRF illuminator, whereas the other was connected to the spinning disk confocal unit.
A spinning disk confocal head was custom fit to the microscope and camera (Yokogawa CSU-X1-M1N-E, Solamere). The dichroic in the spinning disk head was a T405/488/568/647 multiline (Semrock, Rochester, NY). Emission filters were the following from Chroma (Bellows Falls, VT) and in a custom-mounted filter wheel (ASI FW-1000): ET525/50M, ET605/52M, and ET700/75M. Confocal images were captured using a 1024 × 1024 pixel electron-multiplying charge-coupled device camera (Andor iXon3 888, Belfast, Ireland), typically at gain setting 200 and with pixels binned 2 × 2 for higher signal/noise. Axial slice step size was 0.5 μm and extended 20 μm above the coverslip.
TIRF, reflection interference contrast microscopy (RICM), and bright-field images were collected on an Orca-R2 interline charge-coupled device camera (Hamamatsu, Hamamatsu, Japan). Dichroics were 2 mm thick and mounted in metal cubes to preserve optical flatness: ZT488rdc, ZT561rdc, and ZT640rdc. Long-pass emission filters included: ET500lp, ET575lp, and ET660lp. Bandpass emission filters were located below the dichroic turret in a motorized filter wheel (Sutter Lambda 10-3, Novato CA): ET525/50m, ET600/50m, and ET700/75m. RICM was performed using a 50/50 beamsplitter with a D546/10× filter. All TIRF filters and dichroics were from Chroma.
Live-cell imaging was performed using a stage-top incubator and objective heater (Chamlide TC-A, Quorum Technology, Guelph, Canada).
Image analysis
All quantitative image analysis was performed using the ImageJ bundle Fiji (51). For Fig. 2, intensity ratios were measured for the transfected molecules with ephrinA1 both in and out of ephrinA1-enriched regions. Based on TIRF and RICM images, ephrinA1-enriched regions and nonephrinA1 regions were identified. Intensities of the transfected molecules at both regions were measured using Fiji, for each type of molecule and an average of 12 cells were analyzed. In each cell, 3 spots in and out of ephrinA1-enriched regions of each cell were chosen, respectively.
For quantifying ephrinA1 endocytosis, the first few slices of the confocal stacks were removed, thus eliminating the membrane fluorescence and including fluorescence signal only from inside the cell for further analysis. EphrinA1 punctate spots were automatically identified using the Fiji analysis function 3D Objects Counter (52), with a threshold set well above the background (typically three times the average background pixel value) and minimum and maximum spot sizes to eliminate spurious pixels or abnormally large fluorescent blobs (e.g., 5–200 pixels). For several random cells in each sample, mask images outputted from the 3D Objects Counter were visually inspected and compared to the raw data to ensure that the puncta were adequately quantified (see Movie S1). For some samples, the raw images were first blurred using a 1 pixel Gaussian filter before further analysis to increase the accuracy of the automatic object identification.
The Pitstop2-treated cells had slightly dimmer membrane slices on average compared to DMSO control cells. To ensure that the change in endocytosis we measured was a result of Pitstop2 treatment and not due to the amount of ephrinA1 available to the cells, we introduced a simple correction factor based on the membrane brightness on a cell-by-cell basis. The correction factor eliminated the already weak correlation between membrane brightness and number of internal ephrinA1 puncta (Fig. S2), but did not eliminate the significant difference in endocytosis for Pitstop2-treated versus control cells. For grid experiments and cells treated with INCB003619, this correction was not necessary, because we observed no difference in the average brightness of the membrane slices.
For the three-dimensional (3D) time lapse of the living cell in Fig. 3 and the cells on grids in Fig. 4, confocal stacks were first blurred using a 1 pixel Gaussian filter, and then the Interactive Stack Rotation plugin in Fiji was used to force the voxels to be cubes (the plugin uses linear interpolation to add extra z slices); the 3D rendering was performed using UCSF Chimera (53). To normalize the grid plot in Fig. 4 C, the average number of internal ephrinA1 puncta was rescaled for each sample (which contained multiple repeats of each grid pattern) so that the value on 20 μm grid pitches (or off grid for one sample) was unity, so that each sample would be directly comparable. The actual average value at 20 μm is 4.05 puncta/cell, so each value in Fig. 4 C was divided by 4.05.
Figure 3.

Time-lapse 3D reconstructions of confocal stacks of a single living MDAMB231 cell as it lands on a supported membrane displaying ephrinA1. The cell coalesces EphA2-ephrinA1 into large contact regions at the membrane-cell interface, and then internalizes the receptor and ligand over time. Only the ephrinA1 protein is fluorescently labeled (with Alexa Fluor 647), but the images are pseudocolored to encode height above coverslip (blue/green for near the coverslip and magenta for > ∼1 μm above). The gray dome approximates the cell outline, which is not fluorescent in this assay. (See Fig. S4 for a simple grayscale rendering.) An automated object-identification program counted the number of puncta within the cells to measure endocytosis of the EphA2-ephrinA1 complex; only fluorescent spots well above the coverslip and membrane-cell interface (typically 3 μm) were included in the analysis. For experiments quantifying endocytosis in hundreds of cells, samples were fixed at 45 min. Scale bar is 10 μm.
Figure 4.
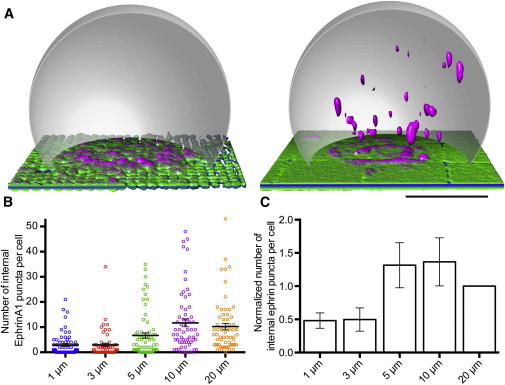
Spatiomechanical inhibition of EphA2-ephrinA1 endocytosis. (A) Fixed MDAMB231 cells on supported membranes that are mechanically restricted by 1 μm (left) or 10 μm (right) grids. On small grid pitches, cells generally exhibited fewer internal ephrinA1 puncta, indicating less endocytosis from the interface. Images are 3D renderings of confocal fluorescence data of ephrinA1 labeled using Alexa Fluor 647 (pseudocolored as in Fig. 3) and a gray dome approximating the cell outline. Scale bar is 10 μm. See also Movie S2. (B) Column scatter graph showing the amount of internalized ephrinA1 in each cell for one representative sample, which contained all grid patterns (e.g., 1, 3, 5, 10, and 20 μm or off grid). Bars are mean ± standard error of the mean. n >50 cells on each grid pitch. Note that for 1 and 3 μm, >40% of the cells contain zero puncta (see Fig. S6). (C) The result of multiple independent repeats of the representative sample shown in B. Values were first normalized to 20 μm in each sample, the normalized values at each grid pitch were then averaged across all samples. Error bars are standard error of the mean, n = 6 samples, each with hundreds of cells. P < 0.05 between 1 and 10 μm grid pitch using ratio paired t-test.
For the radial profile analysis in Fig. S3, the Radial Profile Plot ImageJ plugin written by Paul Baggethun was used. All plots were created and statistical tests were run using GraphPad Prism.
Fig. 1, A and B, were created using Protein Data Base (PDB) structures in Pymol and arranged in Adobe Illustrator. The following PDB files were used: clathrin triskelion PDB ID: 3IYV (54), EphA2-ephrinA5 PDB ID: 2X11 (55) (note that the structure of the full extracellular domain of EphA2 in complex with ephrinA1 is not available so this structure was used instead) and DOPC lipidbook PDB ID: DOPC (56,57).
Results
EphA2-ephrinA1 complexes recruit endocytosis molecules
To provide insight into the components contributing to the mechanical sensitivity of the EphA2 signaling pathway, we sought to understand the biomolecular composition of the large regions of the membrane-cell interface enriched in EphA2-ephrinA1. To find proteins that colocalize with EphA2-ephrinA1 complexes, we screened through a library of candidate signaling molecules using live-cell transfection of fluorescently tagged proteins. TIRF microscopy was used to simultaneously visualize ephrinA1 at the membrane-cell interface and the intracellular signaling molecule. By measuring the fluorescence intensity ratio of the candidate molecule to ephrinA1 both inside and outside the ephrinA1-enriched regions, molecules fell into four distinct spatial categories: molecules either were homogenously distributed throughout the cell membrane, or they colocalized with, antilocalized with, or formed a ring around ephrinA1-enriched regions (Fig. 2 and Fig. S2). Interestingly, the only molecules found to be enriched at EphA2-ephrinA1 were the endocytosis components clathrin and dynamin, as well as ADAM10, at the exclusion of many other molecules. Actin formed a ring around the ephrinA1-enriched regions, consistent with our previous results that receptor reorganization is driven by actomyosin contractility (20). The DiI and the GPI anchor lipid-associated molecules were found to be homogenously distributed across the cell membrane. These localization results indicate that the ephrinA1-enriched regions are sites of clathrin-mediated endocytosis. Therefore, we hypothesized that the signaling sensitivity to physical patterning that we previously observed (20) may be related to endocytosis of the RTK and trans-endocytosis of its ligand from the juxtaposed membrane.
Trans-endocytosis assay development
To test this hypothesis, we developed a quantitative 3D fluorescence assay to characterize the trans-endocytosis of ephrinA1 bound to EphA2. Fluorescently labeled ephrinA1 was imaged inside of breast cancer cells using spinning disk confocal microscopy. Fig. 3 shows time-lapse 3D projections of ephrinA1 internalization over 50 min, demonstrating ephrinA1 endocytosis increasing over time. Immediately after the single cell landed on the ephrinA1-containing supported membrane, ephrinA1 was enriched in regions of contact between the cell and supported membrane as the cell rounds and EphA2 expressed on the surface of the cell bound ephrinA1; those EphA2-ephrinA1 complexes coalesced into large clusters or regions of high EphA2-ephrinA1 concentration. By 30 and 50 min, membrane-cell contact sites increased in size and punctate ephrinA1 spots became visible inside of the cell (see Movie S2).
Because the only fluorescent molecule in the assay was ephrinA1, the fluorescence signal inside the cell is a direct measure of the amount of ligand trans-endocytosed from the supported membrane. Furthermore, we found that the intensity per ephrinA1 punctate spot is relatively narrowly distributed (Fig. S5), so we further streamlined the assay by simply counting the number of ephrinA1 puncta per cell as a measure of internalized protein. Counting internal puncta yields similar results to total internal intensity (Fig. S5), but counting greatly simplifies the analysis, because it is not necessary to subtract background and dark counts; therefore, background differences and user-defined thresholds do not influence the results and the counting analysis is more robust. To automate the process, we used simple image-analysis software to identify spots in three dimensions (see Methods). This method provides a simple and reliable assay for detecting single-cell endocytosis, and it eliminates the high variability inherent in antibody staining to quantify internalized signaling molecules.
Trans-endocytosis is altered as a function of EphA2-ephrinA1 spatial reorganization
Using this trans-endocytosis assay, we examined if ephrinA1 endocytosis is affected by mechanical properties of the membrane-cell interface. Specifically, we physically hindered EphA2-ephrinA1 reorganization in breast cancer cells that highly overexpress EphA2 (20) using patterned supported membranes containing ephrinA1. After incubating on the membranes for 45 min, cells were fixed and imaged using spinning disk confocal microscopy and the amount of ephrinA1 inside each cell was quantified (see Methods). Small corrals inhibited ephrinA1 trans-endocytosis, whereas internalization was successful on unrestricted substrates (Fig. 4 A and Movie S3, A and B). The number of punctate ephrinA1 spots inside of cells on substrates with 1, 3, 5, and 10 μm corrals revealed a significant decrease in the amount of endocytosis on 1 and 3 μm grid sizes (Fig. 4, B and C). Each cell encountered approximately the same amount of ephrinA1 protein, indicating that introducing a spatial and mechanical disruption of EphA2-ephrinA1 movement regulates trans-endocytosis. As a control, transferrin uptake in cells encountering patterned supported membranes with ephrinA1 was also monitored, and we observed no significant change in the uptake of transferrin across the different grid sizes (Fig. S7).
Trans-endocytosis of ephrinA1 requires clathrin and ADAM10
We then asked whether targeted inhibition of the molecules that colocalize with EphA2-ephrinA1 alters ephrinA1 endocytosis. Cells were treated with the small molecule Pitstop2 to inhibit the clathrin terminal domain (58,59). Treatment resulted in a significant decrease in ephrinA1 endocytosis, corroborating that EphA2-ephrinA1 is internalized through a clathrin-mediated endocytosis mechanism (Fig. 5 A). These results indicate that EphA2 must be first bound to ephrinA1, phosphorylated, and then actively internalized, consistent with recent work using soluble, dimeric ephrinA1. Interestingly, the localization of clathrin, dynamin, and caveolin did not differ dramatically for cells on 1 versus 10 μm gridded substrates (Fig. S8), indicating that EphA2 sensitivity to grids is not simply caused by a change in recruitment of endocytosis molecules.
Figure 5.

Drug inhibition of ephrinA1 trans-endocytosis. (A) Blocking the clathrin terminal domain with the small molecule Pitstop2 reduces overall ephrinA1 endocytosis. Bars are mean ± SE, n = 3 samples each condition, with >1000 cells per sample. P < 0.05 using the unpaired t-test. (B) Inhibiting ADAM10 and ADAM17 metalloprotease activity using the small molecule INCB003619 reduces overall ephrinA1 endocytosis. Bars are mean ± range, n = 2 samples each condition, with ∼1000 cells per sample. P < 0.05 using the unpaired t-test.
Because ADAM10 cleaves ephrinA1 and breaks the mechanical linkage to the underlying supported membrane, the metalloprotease may regulate EphA2-ephrinA1 internalization (43). Our prior results indicated that ADAM10 recruitment is significantly reduced in cells on small grids (20), so we hypothesized that the mechanical sensitivity of EphA2-ephrinA1 endocytosis may be related to modified ADAM10 recruitment on grids. We treated cells with the small molecule INCB003619 to inhibit cleavage (60,61) of ephrinA1 by ADAM10 or ADAM17 (Fig. 5 B) and found that inhibiting metalloprotease activity significantly reduced the amount of ephrinA1 inside the cells. This result was consistent with our hypothesis that cleavage of ephrinA1 is required for efficient internalization of the EphA2-ephrinA1 complex, as well as recent work suggesting that ADAM10 is required for trans-endocytosis of Eph receptors (43).
Discussion
Our results indicate that EphA2 signaling and endocytosis is sensitive to spatial and mechanical properties of the apposing cell on the scale of microns. Preventing ephrinA1—and, indirectly, EphA2—from forming large-scale clusters inhibits endocytosis. This represents a noncanonical mechanical sensitivity, because the cells are responding not to adhesion machinery (integrin ligands are not present in the supported membrane) but instead to forces directly influencing an RTK (20).
We also found that chemically inhibiting ADAM10 reduces trans-endocytosis of ephrinA1. Whether ADAM10 recruitment is the primary regulator of EphA2-ephrinA1 internalization remains to be shown: loss of ADAM10 recruitment to small sites of EphA2-ephrinA1 contact may be a result of failed endocytosis instead of the cause.
It is possible that cells on physically restrictive substrates exhibit a systemic shift to a different signaling state, such as changing from a cell rounding behavior on fluid membranes to a cell spreading phenotype on gridded substrates, which would be corroborated by our observation of altered cytoskeletal arrangement on gridded substrates (20). However, our transferrin-uptake results (Fig. S7) indicate that modulating EphA2-ephrinA1 spatial organization does not redefine the entire endocytosis machinery of the cell, even though transferrin also uses a clathrin-mediated endocytosis mechanism (62).
Alternatively, clathrin itself may be responding to the mechanical properties of EphA2-ephrinA1 contact sites or the curvature of the cell membrane. A gridded substrate imparts a pattern on the cell membrane only indirectly, via the cell’s EphA2 bound to corralled ephrinA1 in the underlying patterned supported membrane. The smallest grid size used in this work (1 μm) is sufficiently larger than the size of a clathrin-coated vesicle (∼100 nm) (25,63), but the small grids result in drastically smaller ephrinA1-EphA2 clusters (Fig. 1 C). Our colocalization results indicate that clathrin is still recruited on all grid pitches (Fig. S8), but endocytosis is not as efficient on 1 and 3 μm grids. It is possible that there is a cluster-size threshold for effective endocytosis.
In addition to the obvious factor of cluster size, ephrinA1 patterning may cause impeded endocytosis in other ways. Recent work (64) found that clathrin pit maturation may be impeded by membrane tension. The smaller grid sizes may introduce far more bending (65) in the cell membrane or increased tension reducing efficient pit maturation relative to the larger grid sizes. Furthermore, the cell membrane should exhibit lower local curvature or undulations when EphA2-ephrinA1 complexes are allowed to freely coalesce to large contact sites versus the case where they are corralled by small grids (66,67). This altered membrane curvature (24,68), or possibly even impeded flow of cell membrane lipids (68), may inhibit pit formation or maturation. These mechanisms remain to be explored.
An argument could be made that our results are simply due to a decrease in concentration of ephrinA1 on smaller grid sizes, thereby reducing the amount of material available to be internalized. For instance, regulation of epidermal growth factor receptor (EGFR) endocytosis occurs via two distinct mechanisms, and the balance between the two pathways is determined by the ligand concentration (69): at very high concentrations of the ligand EGF, nonclathrin-mediated endocytosis takes on a larger role (likely because the clathrin machinery is saturated). However, we do not believe our findings were the result of such an effect. First, the grids are barriers to lipid and protein diffusion, but they do not change the protein concentration; therefore, the number of ephrinA1 molecules available to a cell is approximately the same across the different grid sizes. Second, although we did observe some variability in the brightness under different cells, that variability did not correlate with grid pitch. Finally, we found no evidence for significant concentration dependence: we observed only a very weak correlation between ephrinA1 concentration and material internalized (Fig. S2). Instead, the grids primarily disrupt local concentration (i.e., clustering); therefore, we propose that endocytosis is strongly influenced by the large-scale clustering of the RTK-ligand at the membrane-cell interface.
Here we report a quantitative trans-endocytosis assay of ligands on a supported membrane, which mimics a cell-cell junction. These results in conjunction with several recent findings (20–22,40,70,71), support an emerging theme in which receptor movement and large-scale clustering during cell-cell contact dramatically alters how cells signal. This effect ranges from proximal signaling events, such as recruitment of proteins to the membrane, to far-downstream signaling events such as endocytosis. Understanding this regulatory component in greater detail can provide insight into how receptor movement and reorganization might contribute aberrant signaling in cancer, especially in tumors that highly overexpress the EphA2 receptor (72).
Author Contributions
A.C.G., S.J.L., and J.T.G. designed this study and prepared the manuscript; A.C.G., S.J.L., and A.T. performed experiments; A.C.G., S.J.L., A.T., and J.T.G. analyzed the data; C.R. and H.K. fabricated gridded substrates.
Acknowledgments
We thank I. Jeena Lee for assisting with preliminary experiments, and Dr. Aaron Cheng and Dr. David Drubin for many useful discussions, help, and reagents. We also thank the Mechanobiology Institute in Singapore for providing some nanofabricated substrates. We acknowledge the financial support from Department of Defense National Defense Science and Engineering Graduate Fellowship (A.C.G.) and the American Chemical Society Irving S. Sigal Postdoctoral Fellowship (S.J.L.).
This work was supported by the Director, Office of Science, Office of Basic Energy Sciences, Chemical Sciences, Geosciences, and Biosciences Division and the Materials Sciences and Engineering Division of the U.S. Department of Energy under contract number DE-AC02-05CH11231; the Department of Defense W81XWH-11-1-0256; and the National Institutes of Health National Cancer Institute Integrative Cancer Biology Program grant number 1-U54-CA143836. The content is solely the responsibility of the authors and does not necessarily represent the official views of the NCI or the NIH.
Footnotes
Adrienne C. Greene and Samuel J. Lord contributed equally to this work.
Supporting Material
References
- 1.Lackmann M., Boyd A.W. Eph, a protein family coming of age: more confusion, insight, or complexity? Sci. Signal. 2008;1:re2. doi: 10.1126/stke.115re2. [DOI] [PubMed] [Google Scholar]
- 2.Adams R.H., Klein R. Eph receptors and ephrin ligands: essential mediators of vascular development. Trends Cardiovasc. Med. 2000;10:183–188. doi: 10.1016/s1050-1738(00)00046-3. [DOI] [PubMed] [Google Scholar]
- 3.Adams R.H., Wilkinson G.A., Klein R. Roles of ephrinB ligands and EphB receptors in cardiovascular development: demarcation of arterial/venous domains, vascular morphogenesis, and sprouting angiogenesis. Genes Dev. 1999;13:295–306. doi: 10.1101/gad.13.3.295. [DOI] [PMC free article] [PubMed] [Google Scholar]
- 4.Mohamed A.M., Chin-Sang I.D. Characterization of loss-of-function and gain-of-function Eph receptor tyrosine kinase signaling in C. elegans axon targeting and cell migration. Dev. Biol. 2006;290:164–176. doi: 10.1016/j.ydbio.2005.11.019. [DOI] [PubMed] [Google Scholar]
- 5.Miao H., Strebhardt K., Wang B. Inhibition of integrin-mediated cell adhesion but not directional cell migration requires catalytic activity of EphB3 receptor tyrosine kinase. Role of Rho family small GTPases. J. Biol. Chem. 2005;280:923–932. doi: 10.1074/jbc.M411383200. [DOI] [PubMed] [Google Scholar]
- 6.Eph Nomenclature Committee Unified nomenclature for Eph family receptors and their ligands, the ephrins. Cell. 1997;90:403–404. doi: 10.1016/s0092-8674(00)80500-0. [DOI] [PubMed] [Google Scholar]
- 7.Miao H., Wang B. EphA receptor signaling—complexity and emerging themes. Semin. Cell Dev. Biol. 2012;23:16–25. doi: 10.1016/j.semcdb.2011.10.013. [DOI] [PMC free article] [PubMed] [Google Scholar]
- 8.Wykosky J., Debinski W. The EphA2 receptor and ephrinA1 ligand in solid tumors: function and therapeutic targeting. Mol. Cancer Res. 2008;6:1795–1806. doi: 10.1158/1541-7786.MCR-08-0244. [DOI] [PMC free article] [PubMed] [Google Scholar]
- 9.Arvanitis D.N., Davy A. Regulation and misregulation of Eph/ephrin expression. Cell Adhes. Migr. 2012;6:131–137. doi: 10.4161/cam.19690. [DOI] [PMC free article] [PubMed] [Google Scholar]
- 10.Zelinski D.P., Zantek N.D., Kinch M.S. EphA2 overexpression causes tumorigenesis of mammary epithelial cells. Cancer Res. 2001;61:2301–2306. [PubMed] [Google Scholar]
- 11.Ogawa K., Pasqualini R., Pasquale E.B. The ephrin-A1 ligand and its receptor, EphA2, are expressed during tumor neovascularization. Oncogene. 2000;19:6043–6052. doi: 10.1038/sj.onc.1204004. [DOI] [PubMed] [Google Scholar]
- 12.Macrae M., Neve R.M., McCormick F. A conditional feedback loop regulates Ras activity through EphA2. Cancer Cell. 2005;8:111–118. doi: 10.1016/j.ccr.2005.07.005. [DOI] [PubMed] [Google Scholar]
- 13.Vaught D., Brantley-Sieders D.M., Chen J. Eph receptors in breast cancer: roles in tumor promotion and tumor suppression. Breast Cancer Res. 2008;10:217–224. doi: 10.1186/bcr2207. [DOI] [PMC free article] [PubMed] [Google Scholar]
- 14.Pan M. Overexpression of EphA2 gene in invasive human breast cancer and its association with hormone receptor status. J. Clin. Oncol. 2005;23:9583–9584. [Google Scholar]
- 15.Zhuang G., Brantley-Sieders D.M., Chen J. Elevation of receptor tyrosine kinase EphA2 mediates resistance to trastuzumab therapy. Cancer Res. 2010;70:299–308. doi: 10.1158/0008-5472.CAN-09-1845. [DOI] [PMC free article] [PubMed] [Google Scholar]
- 16.Kaenel P., Mosimann M., Andres A.-C. The multifaceted roles of Eph/ephrin signaling in breast cancer. Cell Adhes. Migr. 2012;6:138–147. doi: 10.4161/cam.20154. [DOI] [PMC free article] [PubMed] [Google Scholar]
- 17.Miao H., Li D.-Q., Wang B. EphA2 mediates ligand-dependent inhibition and ligand-independent promotion of cell migration and invasion via a reciprocal regulatory loop with Akt. Cancer Cell. 2009;16:9–20. doi: 10.1016/j.ccr.2009.04.009. [DOI] [PMC free article] [PubMed] [Google Scholar]
- 18.Bissell M.J., Radisky D. Putting tumours in context. Nat. Rev. Cancer. 2001;1:46–54. doi: 10.1038/35094059. [DOI] [PMC free article] [PubMed] [Google Scholar]
- 19.Nelson C.M., Vanduijn M.M., Bissell M.J. Tissue geometry determines sites of mammary branching morphogenesis in organotypic cultures. Science. 2006;314:298–300. doi: 10.1126/science.1131000. [DOI] [PMC free article] [PubMed] [Google Scholar]
- 20.Salaita K., Nair P.M., Groves J.T. Restriction of receptor movement alters cellular response: physical force sensing by EphA2. Science. 2010;327:1380–1385. doi: 10.1126/science.1181729. [DOI] [PMC free article] [PubMed] [Google Scholar]
- 21.Xu Q., Lin W.-C., Groves J.T. EphA2 receptor activation by monomeric Ephrin-A1 on supported membranes. Biophys. J. 2011;101:2731–2739. doi: 10.1016/j.bpj.2011.10.039. [DOI] [PMC free article] [PubMed] [Google Scholar]
- 22.Lohmüller T., Xu Q., Groves J.T. Nanoscale obstacle arrays frustrate transport of EphA2-Ephrin-A1 clusters in cancer cell lines. Nano Lett. 2013;13:3059–3064. doi: 10.1021/nl400874v. [DOI] [PMC free article] [PubMed] [Google Scholar]
- 23.Polo S., Di Fiore P.P. Endocytosis conducts the cell signaling orchestra. Cell. 2006;124:897–900. doi: 10.1016/j.cell.2006.02.025. [DOI] [PubMed] [Google Scholar]
- 24.Liu J., Sun Y., Drubin D.G. Mechanochemical crosstalk during endocytic vesicle formation. Curr. Opin. Cell Biol. 2010;22:36–43. doi: 10.1016/j.ceb.2009.11.009. [DOI] [PMC free article] [PubMed] [Google Scholar]
- 25.McMahon H.T., Boucrot E. Molecular mechanism and physiological functions of clathrin-mediated endocytosis. Nat. Rev. Mol. Cell Biol. 2011;12:517–533. doi: 10.1038/nrm3151. [DOI] [PubMed] [Google Scholar]
- 26.Parachoniak C.A., Park M. Dynamics of receptor trafficking in tumorigenicity. Trends Cell Biol. 2012;22:231–240. doi: 10.1016/j.tcb.2012.02.002. [DOI] [PubMed] [Google Scholar]
- 27.Wiley H.S., Burke P.M. Regulation of receptor tyrosine kinase signaling by endocytic trafficking. Traffic. 2001;2:12–18. doi: 10.1034/j.1600-0854.2001.020103.x. [DOI] [PubMed] [Google Scholar]
- 28.Sadowski L., Pilecka I., Miaczynska M. Signaling from endosomes: location makes a difference. Exp. Cell Res. 2009;315:1601–1609. doi: 10.1016/j.yexcr.2008.09.021. [DOI] [PubMed] [Google Scholar]
- 29.Marston D.J., Dickinson S., Nobes C.D. Rac-dependent trans-endocytosis of ephrinBs regulates Eph-ephrin contact repulsion. Nat. Cell Biol. 2003;5:879–888. doi: 10.1038/ncb1044. [DOI] [PubMed] [Google Scholar]
- 30.Zimmer M., Palmer A., Klein R. EphB-ephrinB bi-directional endocytosis terminates adhesion allowing contact mediated repulsion. Nat. Cell Biol. 2003;5:869–878. doi: 10.1038/ncb1045. [DOI] [PubMed] [Google Scholar]
- 31.Pitulescu M.E., Adams R.H. Eph/ephrin molecules—a hub for signaling and endocytosis. Genes Dev. 2010;24:2480–2492. doi: 10.1101/gad.1973910. [DOI] [PMC free article] [PubMed] [Google Scholar]
- 32.Zhuang G., Hunter S., Chen J. Regulation of EphA2 receptor endocytosis by SHIP2 lipid phosphatase via phosphatidylinositol 3-Kinase-dependent Rac1 activation. J. Biol. Chem. 2007;282:2683–2694. doi: 10.1074/jbc.M608509200. [DOI] [PubMed] [Google Scholar]
- 33.Irie F., Okuno M., Yamaguchi Y. EphrinB-EphB signalling regulates clathrin-mediated endocytosis through tyrosine phosphorylation of synaptojanin 1. Nat. Cell Biol. 2005;7:501–509. doi: 10.1038/ncb1252. [DOI] [PMC free article] [PubMed] [Google Scholar]
- 34.Groves J.T., Boxer S.G. Electric field-induced concentration gradients in planar supported bilayers. Biophys. J. 1995;69:1972–1975. doi: 10.1016/S0006-3495(95)80067-6. [DOI] [PMC free article] [PubMed] [Google Scholar]
- 35.Groves J.T., Wülfing C., Boxer S.G. Electrical manipulation of glycan-phosphatidyl inositol-tethered proteins in planar supported bilayers. Biophys. J. 1996;71:2716–2723. doi: 10.1016/S0006-3495(96)79462-6. [DOI] [PMC free article] [PubMed] [Google Scholar]
- 36.Wykosky J., Palma E., Debinski W. Soluble monomeric EphrinA1 is released from tumor cells and is a functional ligand for the EphA2 receptor. Oncogene. 2008;27:7260–7273. doi: 10.1038/onc.2008.328. [DOI] [PMC free article] [PubMed] [Google Scholar]
- 37.Lema Tomé C.M., Palma E., Debinski W. Structural and functional characterization of monomeric EphrinA1 binding site to EphA2 receptor. J. Biol. Chem. 2012;287:14012–14022. doi: 10.1074/jbc.M111.311670. [DOI] [PMC free article] [PubMed] [Google Scholar]
- 38.Beauchamp A., Lively M.O., Debinski W. EphrinA1 is released in three forms from cancer cells by matrix metalloproteases. Mol. Cell. Biol. 2012;32:3253–3264. doi: 10.1128/MCB.06791-11. [DOI] [PMC free article] [PubMed] [Google Scholar]
- 39.Groves J.T., Ulman N., Boxer S.G. Micropatterning fluid lipid bilayers on solid supports. Science. 1997;275:651–653. doi: 10.1126/science.275.5300.651. [DOI] [PubMed] [Google Scholar]
- 40.DeMond A.L., Mossman K.D., Groves J.T. T cell receptor microcluster transport through molecular mazes reveals mechanism of translocation. Biophys. J. 2008;94:3286–3292. doi: 10.1529/biophysj.107.119099. [DOI] [PMC free article] [PubMed] [Google Scholar]
- 41.Mossman K.D., Campi G., Dustin M.L. Altered TCR signaling from geometrically repatterned immunological synapses. Science. 2005;310:1191–1193. doi: 10.1126/science.1119238. [DOI] [PubMed] [Google Scholar]
- 42.Janes P.W., Saha N., Nikolov D.B. Adam meets Eph: an ADAM substrate recognition module acts as a molecular switch for ephrin cleavage in trans. Cell. 2005;123:291–304. doi: 10.1016/j.cell.2005.08.014. [DOI] [PubMed] [Google Scholar]
- 43.Atapattu L., Saha N., Janes P.W. Antibodies binding the ADAM10 substrate recognition domain inhibit Eph function. J. Cell Sci. 2012;125:6084–6093. doi: 10.1242/jcs.112631. [DOI] [PMC free article] [PubMed] [Google Scholar]
- 44.Lin W.-C., Yu C.H., Groves J.T. Supported membrane formation, characterization, functionalization, and patterning for application in biological science and technology. Curr. Protoc. Chem. Biol. 2010;2:235–269. doi: 10.1002/9780470559277.ch100131. [DOI] [PubMed] [Google Scholar]
- 45.Nye J.A., Groves J.T. Kinetic control of histidine-tagged protein surface density on supported lipid bilayers. Langmuir. 2008;24:4145–4149. doi: 10.1021/la703788h. [DOI] [PubMed] [Google Scholar]
- 46.Doyon J.B., Zeitler B., Drubin D.G. Rapid and efficient clathrin-mediated endocytosis revealed in genome-edited mammalian cells. Nat. Cell Biol. 2011;13:331–337. doi: 10.1038/ncb2175. [DOI] [PMC free article] [PubMed] [Google Scholar]
- 47.Triffo S.B., Huang H.H., Groves J.T. Monitoring lipid anchor organization in cell membranes by PIE-FCCS. J. Am. Chem. Soc. 2012;134:10833–10842. doi: 10.1021/ja300374c. [DOI] [PMC free article] [PubMed] [Google Scholar]
- 48.Stauffer T.P., Ahn S., Meyer T. Receptor-induced transient reduction in plasma membrane PtdIns(4,5)P2 concentration monitored in living cells. Curr. Biol. 1998;8:343–346. doi: 10.1016/s0960-9822(98)70135-6. [DOI] [PubMed] [Google Scholar]
- 49.Burkel B.M., von Dassow G., Bement W.M. Versatile fluorescent probes for actin filaments based on the actin-binding domain of utrophin. Cell Motil. Cytoskeleton. 2007;64:822–832. doi: 10.1002/cm.20226. [DOI] [PMC free article] [PubMed] [Google Scholar]
- 50.Edelstein A., Amodaj N., Stuurman N. Computer control of microscopes using μManager. Curr. Protoc. Mol. Biol. 2010;92:1–22. doi: 10.1002/0471142727.mb1420s92. [DOI] [PMC free article] [PubMed] [Google Scholar]
- 51.Schindelin J., Arganda-Carreras I., Cardona A. Fiji: an open-source platform for biological-image analysis. Nat. Methods. 2012;9:676–682. doi: 10.1038/nmeth.2019. [DOI] [PMC free article] [PubMed] [Google Scholar]
- 52.Bolte S., Cordelières F.P. A guided tour into subcellular colocalization analysis in light microscopy. J. Microsc. 2006;224:213–232. doi: 10.1111/j.1365-2818.2006.01706.x. [DOI] [PubMed] [Google Scholar]
- 53.Pettersen E.F., Goddard T.D., Ferrin T.E. UCSF Chimera—a visualization system for exploratory research and analysis. J. Comput. Chem. 2004;25:1605–1612. doi: 10.1002/jcc.20084. [DOI] [PubMed] [Google Scholar]
- 54.Fotin A., Cheng Y., Walz T. Molecular model for a complete clathrin lattice from electron cryomicroscopy. Nature. 2004;432:573–579. doi: 10.1038/nature03079. [DOI] [PubMed] [Google Scholar]
- 55.Seiradake E., Harlos K., Jones E.Y. An extracellular steric seeding mechanism for Eph-ephrin signaling platform assembly. Nat. Struct. Mol. Biol. 2010;17:398–402. doi: 10.1038/nsmb.1782. [DOI] [PMC free article] [PubMed] [Google Scholar]
- 56.Berger O., Edholm O., Jähnig F. Molecular dynamics simulations of a fluid bilayer of dipalmitoylphosphatidylcholine at full hydration, constant pressure, and constant temperature. Biophys. J. 1997;72:2002–2013. doi: 10.1016/S0006-3495(97)78845-3. [DOI] [PMC free article] [PubMed] [Google Scholar]
- 57.Domański J., Stansfeld P.J., Beckstein O. Lipidbook: a public repository for force-field parameters used in membrane simulations. J. Membr. Biol. 2010;236:255–258. doi: 10.1007/s00232-010-9296-8. [DOI] [PubMed] [Google Scholar]
- 58.von Kleist L., Stahlschmidt W., Haucke V. Role of the clathrin terminal domain in regulating coated pit dynamics revealed by small molecule inhibition. Cell. 2011;146:471–484. doi: 10.1016/j.cell.2011.06.025. [DOI] [PubMed] [Google Scholar]
- 59.Dutta D., Williamson C.D., Donaldson J.G. Pitstop 2 is a potent inhibitor of clathrin-independent endocytosis. PLoS ONE. 2012;7:e45799. doi: 10.1371/journal.pone.0045799. [DOI] [PMC free article] [PubMed] [Google Scholar]
- 60.Fridman J.S., Caulder E., Vaddi K. Selective inhibition of ADAM metalloproteases as a novel approach for modulating ErbB pathways in cancer. Clin. Cancer Res. 2007;13:1892–1902. doi: 10.1158/1078-0432.CCR-06-2116. [DOI] [PubMed] [Google Scholar]
- 61.Zhou B.-B.S., Peyton M., Scherle P.A. Targeting ADAM-mediated ligand cleavage to inhibit HER3 and EGFR pathways in non-small cell lung cancer. Cancer Cell. 2006;10:39–50. doi: 10.1016/j.ccr.2006.05.024. [DOI] [PMC free article] [PubMed] [Google Scholar]
- 62.Le Roy C., Wrana J.L. Clathrin- and non-clathrin-mediated endocytic regulation of cell signalling. Nat. Rev. Mol. Cell Biol. 2005;6:112–126. doi: 10.1038/nrm1571. [DOI] [PubMed] [Google Scholar]
- 63.Heuser J., Kirchhausen T. Deep-etch views of clathrin assemblies. J. Ultrastruct. Res. 1985;92:1–27. doi: 10.1016/0889-1605(85)90123-5. [DOI] [PubMed] [Google Scholar]
- 64.Boulant S., Kural C., Kirchhausen T. Actin dynamics counteract membrane tension during clathrin-mediated endocytosis. Nat. Cell Biol. 2011;13:1124–1131. doi: 10.1038/ncb2307. [DOI] [PMC free article] [PubMed] [Google Scholar]
- 65.Stachowiak J.C., Schmid E.M., Hayden C.C. Membrane bending by protein-protein crowding. Nat. Cell Biol. 2012;14:944–949. doi: 10.1038/ncb2561. [DOI] [PubMed] [Google Scholar]
- 66.Parthasarathy R., Groves J.T. Curvature and spatial organization in biological membranes. Soft Matter. 2007;3:24–33. doi: 10.1039/b608631d. [DOI] [PubMed] [Google Scholar]
- 67.Parthasarathy R., Yu C.H., Groves J.T. Curvature-modulated phase separation in lipid bilayer membranes. Langmuir. 2006;22:5095–5099. doi: 10.1021/la060390o. [DOI] [PubMed] [Google Scholar]
- 68.Rangamani P., Agrawal A., Steigmann D.J. Interaction between surface shape and intra-surface viscous flow on lipid membranes. Biomech. Model. Mechanobiol. 2013;12:833–845. doi: 10.1007/s10237-012-0447-y. [DOI] [PMC free article] [PubMed] [Google Scholar]
- 69.Sigismund S., Argenzio E., Di Fiore P.P. Clathrin-mediated internalization is essential for sustained EGFR signaling but dispensable for degradation. Dev. Cell. 2008;15:209–219. doi: 10.1016/j.devcel.2008.06.012. [DOI] [PubMed] [Google Scholar]
- 70.Carroll-Portillo A., Spendier K., Timlin J.A. Formation of a mast cell synapse: Fc epsilon RI membrane dynamics upon binding mobile or immobilized ligands on surfaces. J. Immunol. 2010;184:1328–1338. doi: 10.4049/jimmunol.0903071. [DOI] [PMC free article] [PubMed] [Google Scholar]
- 71.Hartman N.C., Nye J.A., Groves J.T. Cluster size regulates protein sorting in the immunological synapse. Proc. Natl. Acad. Sci. USA. 2009;106:12729–12734. doi: 10.1073/pnas.0902621106. [DOI] [PMC free article] [PubMed] [Google Scholar]
- 72.Xi H.-Q., Wu X.-S., Chen L. Eph receptors and ephrins as targets for cancer therapy. J. Cell. Mol. Med. 2012;16:2894–2909. doi: 10.1111/j.1582-4934.2012.01612.x. [DOI] [PMC free article] [PubMed] [Google Scholar]
Associated Data
This section collects any data citations, data availability statements, or supplementary materials included in this article.