
Figure 2.
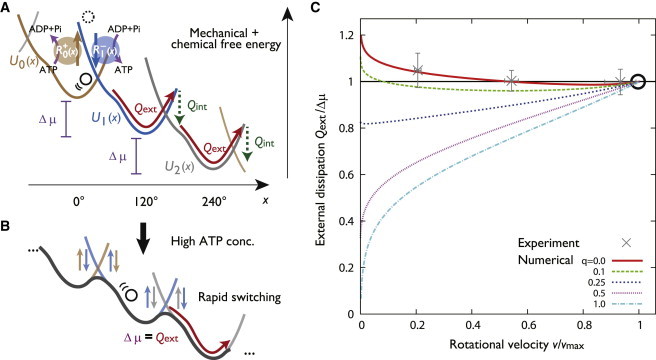
External heat dissipation defined in the molecular motor model and its dependence on transport velocity. (A) Potential switching model and schematic of the heat dissipation for the hydrolysis-driven rotation of F1 in the absence of applied external torque (F = 0). The black circle represents the angular position of the probe bead attached to the γ subunit. The kinetics of x is described by an overdamped Brownian motion inside each potential. Potentials are switched according to the angular position dependent rates . (B) Effective potential in the high ATP concentration limit. Since the switching dynamics is fast, the independent potentials become invisible, and the dynamics follows the tilted periodic potential description, irrespective of the form of . In this limit, the external dissipation becomes equal to . (C) Rotational velocity v versus the external heat dissipation per step . The red line is the case of the TASAM (q = 0), and the other lines correspond to various models introduced by Eq. 5. Experimental data were obtained from Toyabe et al. (14). (Errorbars: standard error of mean). The black circle indicates the high ATP concentration limit. To see this figure in color, go online.