
Figure 3.
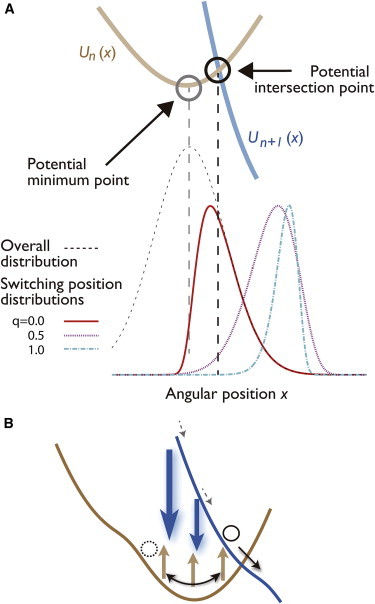
Switching position distribution of the TASAM. (A) Distribution of the switching angular position at the slow rotation rate condition. Numerically obtained switching position distribution in the q = 0 (red), 0.5 (pink), and 1 (light blue) models, compared for the same rotational rate v = 2 Hz (low velocity). The vertical axis is arbitrarily scaled. Although the steady-state distribution of the q = 0 model (black dotted line) has a peak at the minimum point of , the switching position density clearly has a peak around the intersection point, which is consistent with experiment (24). (B) Mechanism behind the internal dissipation-free feature of the TASAM. The potential switching may occur at any angle in the TASAM (brown arrows), whereas the backward switching of the potential follows instantaneously if the energy required for the forward switching was too large (blue arrows). Suppression of switching at high energy difference positions lets the switching to occur only around the potential intersection point, leading to the feature. To see this figure in color, go online.