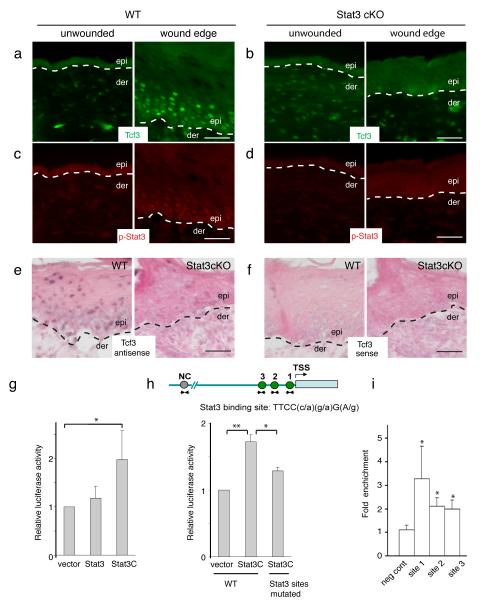
Figure 3. Tcf3 induction in response to wounding is dependent on Stat3.
(a-b) Full-thickness wounds were created on dorsal skins of 10-week old mice and isolated 5 days post wounding. Skins containing the wound sites were analyzed by immunofluorescence with antibodies against phospho-Y705-Stat3 (red) and Tcf3 (Green). Unwounded skins from the same mice were used as controls. Bar denotes 50μm.
(c-d) Images of immunofluorescence analysis of the wound edge of skin from Stat3fl/fl;K14-Cre (Stat3 cKO) mice. Unwounded skins from the same mice were used as controls.
(e-f) In situ hybridization analysis of Tcf3 expression at the wound edge of wild-type and Stat3 ckO skin using antisense to Tcf3 as probe (e) compared with Tcf3 sense as a control (f). Bar denotes 50μm.
(g) Keratinocytes were transfected with Tcf3 promoter-Firefly luciferase and Renilla luciferase constructs, together with constructs expressing either Stat3, constitutively active Stat3 (Stat3C) or control vector. Luciferase activity was measured and Firefly luciferase activity was normalized over Renilla luciferase activity. Graph shows normalized luciferase activity relative to vector control. Experiments were repeated three times. Data are mean ± s.d. *p<0.05 (Student’s t-test).
(h) Schematic showing Stat3 binding sites on Tcf3 promoter. Keratinocytes were transfected with wild-type or mutated Tcf3 promoter-Firefly luciferase and Renilla luciferase constructs, together with constructs expressing Stat3C or empty vector. Graph shows normalized luciferase activity relative to vector control. Experiments were repeated three times. Data are mean ± s.d. *p<0.05, **p<0.01 (Student’s t-test).
(i) Chromatin immunoprecipitation (ChIP) was performed with anti-Stat3 or isotype control antibodies on crosslinked hair follicle cell chromatin lysate. Amount of chromatin precipitated by Stat3 or IgG was measured by qPCR using primers spanning regions containing Stat3 binding sites (sites 1-3) or regions without Stat3 conserved binding sites (neg cont). The graph shows the amount of fold enrichment of Stat3-immunoprecipitated DNA relative to IgG-immunoprecipitated DNA. Experiments were repeated three times. Data are mean ± s.d. *p<0.05 (Student’s t-test).

