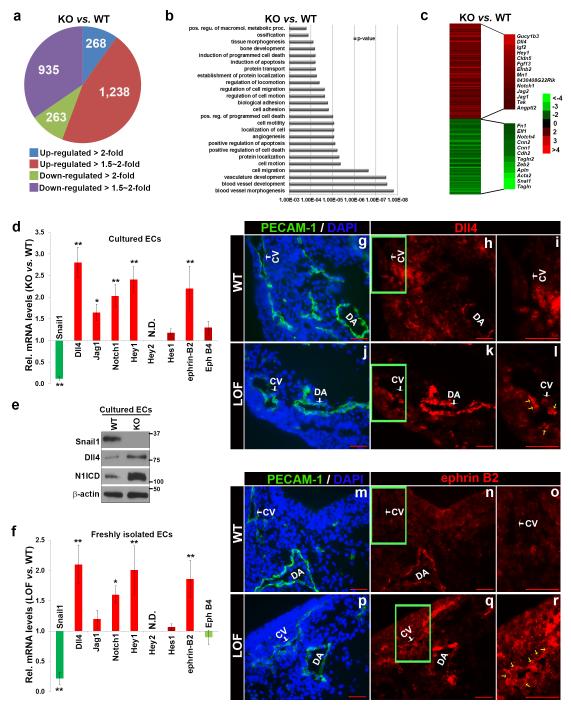
Figure 5. Upregulated Notch Signaling in Snail1-deleted ECs.
(a-c) Transcriptional profiling analysis of cultured ECs derived from E10.5 Snail1fl/fl embryos and transduced in vitro with Adeno-β-gal or Adeno-Cre to induce Snail1 KO recombination. Pie chart depicts the distribution of total transcripts changed in Snail1-deleted ECs as compared to control ECs (a). Gene ontology (GO) analysis of Snail1-deleted vs. control ECs (b). Heat map representation of microarray data highlights the expression levels of key transcription factors, arterial-venous specification genes, EnMT-related genes as well as Notch signaling target genes (c).
(d) RT-qPCR analysis of cultured ECs from (a). Snail1 KO ECs presented significantly higher levels of Dll4, Jag1, Notch1, Hey1 and ephrin-B2. Data are presented as mean ± SEM (n=3). *p < 0.05, **p < 0.01, Student’s t test.
(e) Western blot analysis of cultured ECs from (a).
(f) RT-qPCR analysis of ECs freshly isolated from E10.5 WT and Snail1 KO embryos. ECs isolated from Snail1 LOF embryos displayed significantly higher levels of Dll4, Notch1, Hey1 and ephrin-B2 (n=6 each). Data are presented as mean ± SEM. *p < 0.05, **p < 0.01, Student’s t test.
(g-l) Cross-sections from E10.5 WT and Snail1 LOF mutant embryos were co-stained with anti-PECAM-1 and anti-Dll4 antibodies. Cell nuclei were stained with DAPI (blue). [i] and [l], magnified area in [h] and [k], respectively. Yellow arrow depicts Dll4-positive ECs in CV region. Scale bars: 50 μm.
(m-r) Cross-sections from E10.5 WT and Snail1 LOF mutant embryos were co-stained with anti-PECAM-1 and anti-ephrin B2 antibodies. Cell nuclei were stained with DAPI (blue). [o] and [r], magnified area in [n] and [q], respectively. Yellow arrow depicts ephrin B2-positive ECs in CV region. Scale bars: 50 μm.

