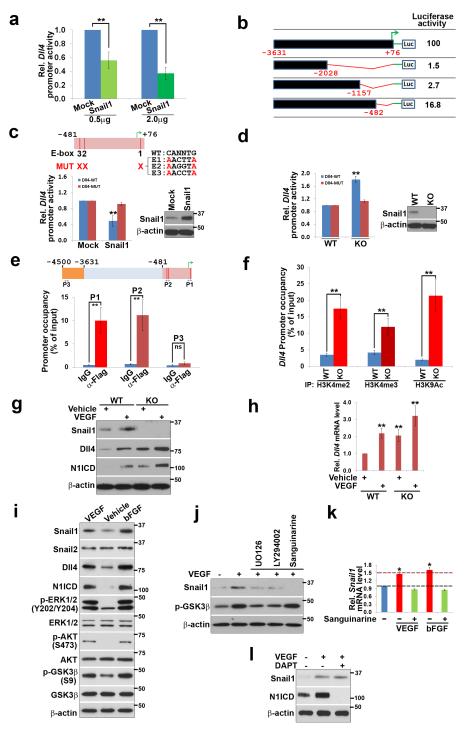
Figure 7. EC Snail1 Regulates Notch Activity through Direct Transcriptional Repression of Dll4.
(a) ECs derived from E10.5 Snail1fl/fl embryos were electroporated with a mock or Snail1 expression vector (0.5 μg or 2.0 μg) in combination with 0.5 μg of a mouse Dll4 promoter reporter construct and luciferase activity determined. (mean ± SEM; n=3). *p < 0.05, **p < 0.01, Student’s t test.
(b) ECs from (A) were electroporated with full-length or deleted Dll4 promoter reporter constructs and subjected to luciferase assay (results are of 3 experiments performed).
(c) Diagram depicts the mutations in the three E-boxes located within the proximal region of the mouse Dll4 promoter. Cultured ECs from (a) were electroporated with mock or human Snail1 expression vectors in combination with wild type (WT) or mutated (MUT) Dll4 promoter reporter constructs. Luciferase assays and Western blot analysis are shown. (mean ± SEM; n=3). **p < 0.01, Student’s t test.
(d) Cultured control or Snail1-deleted ECs were electroporated with WT or MUT Dll4 promoter reporter constructs for luciferase assay (left) and Western blot analysis (right). (mean ± SEM; n=3). **p < 0.01, Student’s t test.
(e) Snail1-Dll4 promoter interactions in ECs expressing a Snail1 expression vector were assessed within the indicated regions (P1~P3) by ChIP/qPCR. (mean ± SEM; n=3). **p < 0.01, Student’s t test.
(f) Lysates from cultured control or Snail1-deleted ECs were subjected to ChIP analysis using antibodies directed against H3K4me2, H3K4me3 or H3K9Ac and Dll4 occupancy determined by qPCR. (mean ± SEM; n=3). **p < 0.01, Student’s t test.
(g,h) Control and Snail1-deleted ECs were treated with vehicle or VEGF for 12 h, and subjected to Western blot (g) or RT-qPCR analysis (h), respectively. Western results are representative of 3 experiments with RT-qPCR results presented as mean ± SEM (n=3). **p < 0.01, ANOVA.
(i) WT ECs were stimulated with vehicle, VEGF (100 ng/ml) or bFGF (20 ng/ml) for 12 h and subjected to Western blot analysis. Results are representative of 3 or more experiments.
(j,k) WT ECs were pretreated with U0126 (20 μM), LY294002 (10 μM) or sanguinarine (2.5 μM) for 1 h followed by stimulation with VEGF or bFGF for 12 h. Cell lysates were prepared and subjected to Western blot (j) and RT-qPCR (k) analysis, respectively. Western results representative of 3 experiments with RT-qPCR results presented as mean ± SEM (n=3). **p < 0.01, ANOVA.
(l) WT ECs were pretreated with vehicle or DAPT (8 μM) for 1 h followed by stimulation with VEGF (100 ng/ml) for 12 h. Cell lysates were prepared and subjected to Western blot analysis. Results are representative of 3 experiments.

