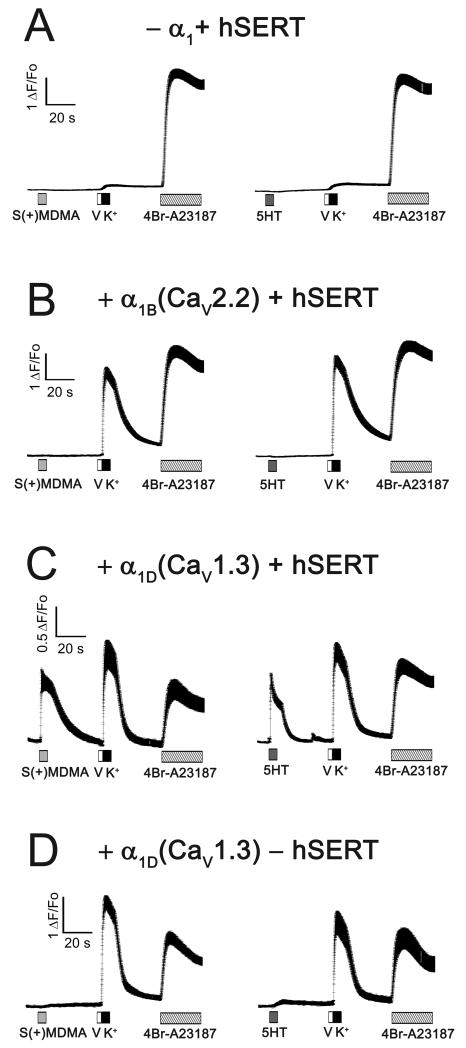
Figure 6. The depolarization induced by hSERT activation is electrically coupled to CaV1.3 opening.
HEK293T cells were loaded with the permeable Ca2+ sensitive dye Fluo-4AM and the intracellular Ca2+ concentration was measured by fluorescence microscopy at an acquisition rate of 50 Hz. All measurements were done at 35°C under constant perfusion. The tested cells were transfected with the following plasmids: (A) hSERT-IRES-DsRed (without CaV channel); (B) α1B (CaV2.2) and hSERT-IRES-DsRed; (C) α1D (CaV1.3) and hSERT-IRES-DsRed; (D) α1D (CaV1.3) and DsRed (without transporter). In all cases the β3 and α2γ1 plasmids were included in the transfection mix. The transfected cells were identified by their DsRed fluorescence. (A-D) As indicated in each trace, the cells were exposed to 10 μM S(+)MDMA (light gray box) or 10 μM 5HT (dark gray box) for 5 s. After wash the cells were exposed to 200 nM valinomycin (V, white box) for 2 s to increase the K+ permeability and were immediately exposed to 130 mM K+ solution for 5 s (K+, black box) to depolarize the cells toward positive potentials, then after wash the cells were exposed to 3μM 4Br-A23187, a Ca2+ionophore. The traces shown are mean ± s.e.m. of n ≥ 20 cells.

