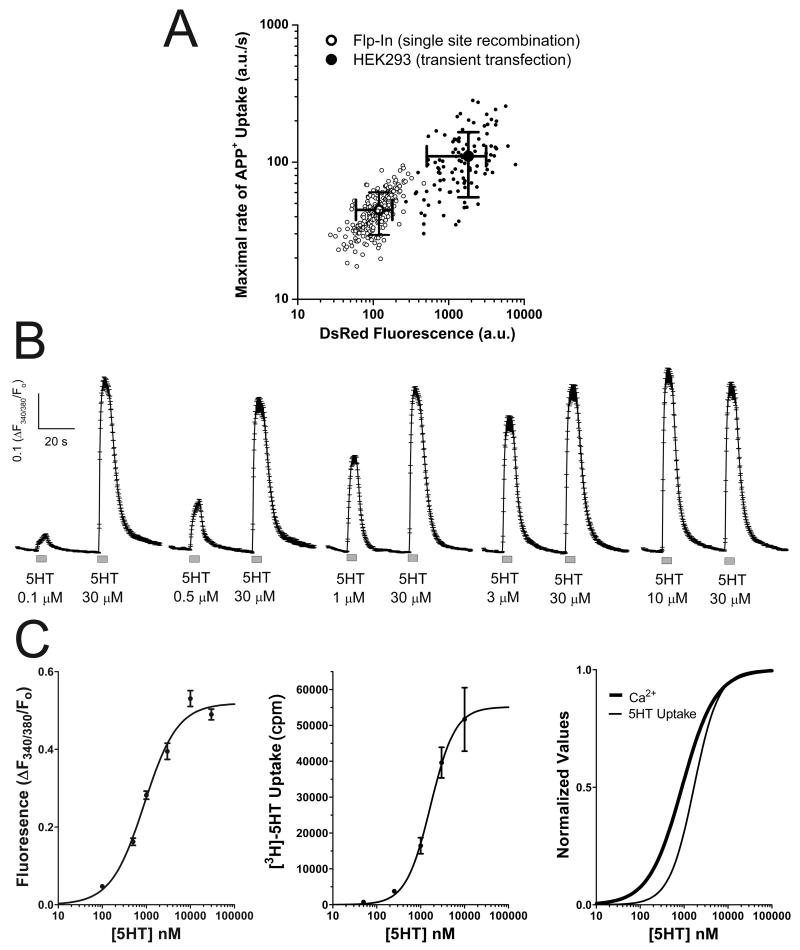
Figure 7. The electrical coupling between hSERT and CaV1.3 take place in the physiological concentration range of 5HT.
(A) Flp-In™ T-Rex™ cells (Flp-In, open circles) expressing the hSERT-IRES-DsRed construct were generated as described in Materials and methods, and HEK293 cells (closed circles) were subjected to transient transfection using the hSERT-IRES-DsRed plasmid. To compare the activity of hSERT among cell types, the maximal rate of APP+ uptake was measured computing the maximum of the first derivative of APP+ signal as function of time. In addition, the DsRed signal was measured for each cell. The maximal rate of APP+ uptake (y axis) and DsRED fluorescence (x axis) is plotted for each individual cell (note that the axis are in logarithmic scale) and the values shown are the mean ± standard deviation. The hSERT activity was 44.8*** ± 15.4 (a.u./s), and 110.4 ± 55.0 (a.u./s) for Flp-In cells (n = 202) and HEK293 cells (n = 107), respectively (*** = p < 0.0001, t-test). The DsRed signal was 119*** ± 60 (a.u.) and 1,821 ± 1,310, for Flp-In cells (n = 202) and HEK293 cells (n = 107), respectively (*** = p < 0.0001, t-test). (B) Flp-In cells were transiently transfected with CaV1.3 as described in Materials and methods, the transfected cells were identified by the EGFP fluorescence and the Ca2+ signal was determined using Fura-2AM. Measurements were done under constant perfusion at 35°C and the acquisition frequency was 3Hz. The cells were exposed to a variable concentration of 5HT followed by 30μM 5HT to record the maximal response. The traces shown are mean ± s.e.m. of n ≥ 57 cells for each condition. (C) The dose-response experiments shown in B were fit to Eq. 2 (Materials and methods) and yield the following fitting parameters for the 5HT- dependent Ca2+ signal: Maximal Response = 0.519 ± 0.013 ([F340/380/Fo]), EC50 = 0.90 ± 0.08 (μM) and Hill Slope = 1.15 ± 0.12 (n > 57). The dose response of [3H]-5HT uptake in Flp-In cells was fit to eq.2 (Materials and methods) and yield de following parameters. Maximal Response = 55,155 ± 5,512 (cpm), EC50 = 1.68 ± 0.38** (μM) and Hill Slope = 1.55 ± 0.43 (n = 5, ** = p < 0.01 vs EC50 of Ca2+ experiments, t-test). The fitted curves of the Ca2+ signal and [3H]-5HT uptake experiments were normalized and superimposed for better comparison.

