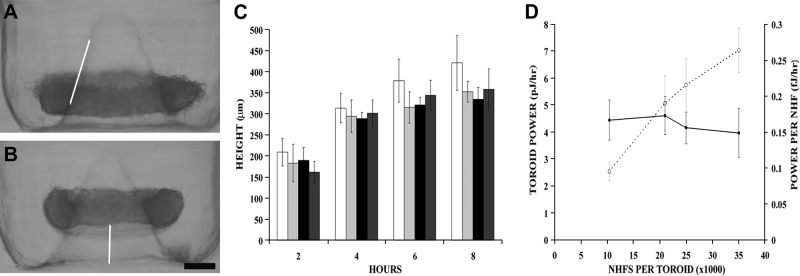
Figure 1.

Toroid height and NHF cell power were constant regardless of cell numbers. A, B) NHFs were seeded into toroid micromolds with increasing cells per toroid. Side view images of the toroids were taken at 2 h (A) and 4 h (B). As early as 2 h, the toroid had begun to move up the cone (line added to show slope) and continued up the cone. C) Toroid height was measured from the bottom of the well to the bottom of the toroid at 2-h intervals for 8 h for 10,500 (open bars), 21,000 (light shaded bars), 25,000 (solid bars), and 35,000 (dark shaded bars) cells/toroid. D)Toroid power (○) was directly proportional to the number of cells within the toroid (R2=0.97), whereas cell power (●) was constant over the range of cell numbers tested (P>0.05). n = 5, 8, 7, and 4 for the 10,500, 21,000, 25,000, and 35,000 cells/toroid samples, respectively. Scale bar = 200 μm.
