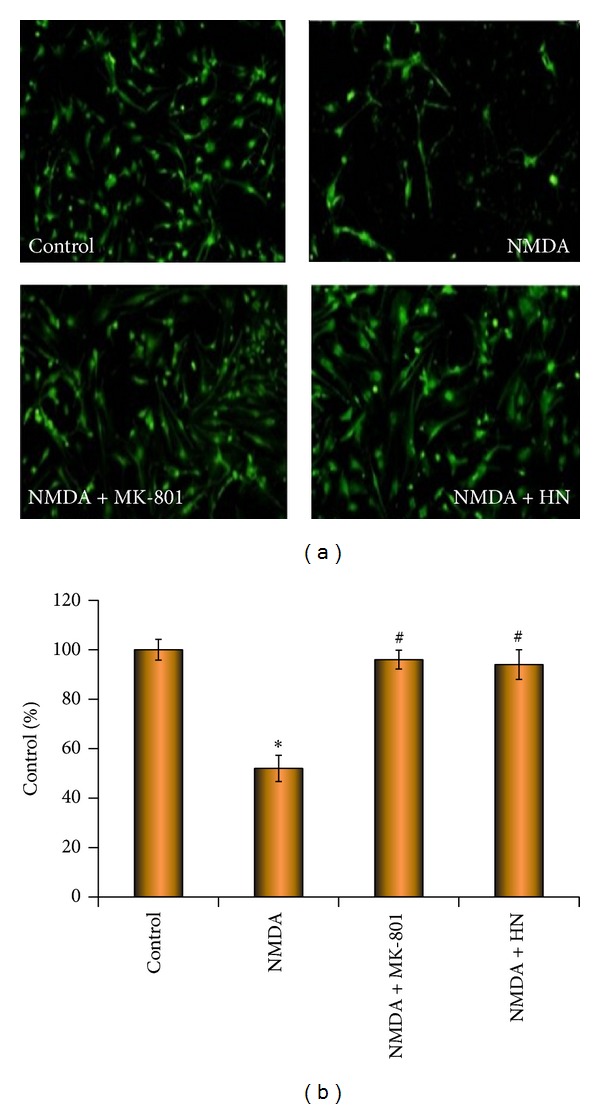
Figure 2.

Effect of humanin on density of living neurons under the challenge of NMDA. Representative cellular density of each group is shown by calcein staining under fluorescence microscope. Each bar represents mean ± SEM of eight independent observations. The date from each observation is expressed as the percentage of fluorescent cells in each group compared with control (100%). Statistical significance is at P < 0.05. F (3,116) = 4.826 and P = 0.003 according to one-way ANOVA analysis. ∗ represents control versus NMDA group, P = 0.012; # represents NMDA group versus NMDA + MK-801 group (P = 0.026) or NMDA + HN (Humanin) group (P = 0.009). ∗ and # mean the existence of statistical significance between.
