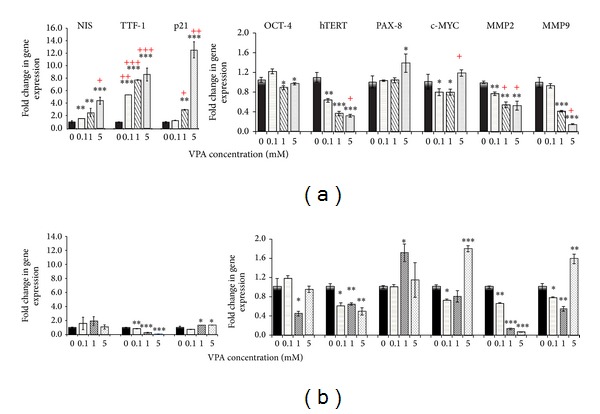
Figure 4.

Effect of 96 h VPA treatment on mRNA transcriptional level. The relative mRNA expression of NIS, TTF1, p21, OCT-4, hTERT, PAX8, c-MYC, MMP2, and MMP9 was measured following VPA treatment. The relative mRNA expression of each gene was measured by qRT-PCR in the 0.1, 1, and 5 mmol/L VPA treated 8305C (a) and B-CPAP (b) cell lines as described in Section 2. Data are presented as mean ± SD. *P < 0.05, **P < 0.01, and ***P < 0.001. + two cell lines compared to each other. Statistical significance was calculated using paired two-tailed Student's t-tests.
