
Figure 2.
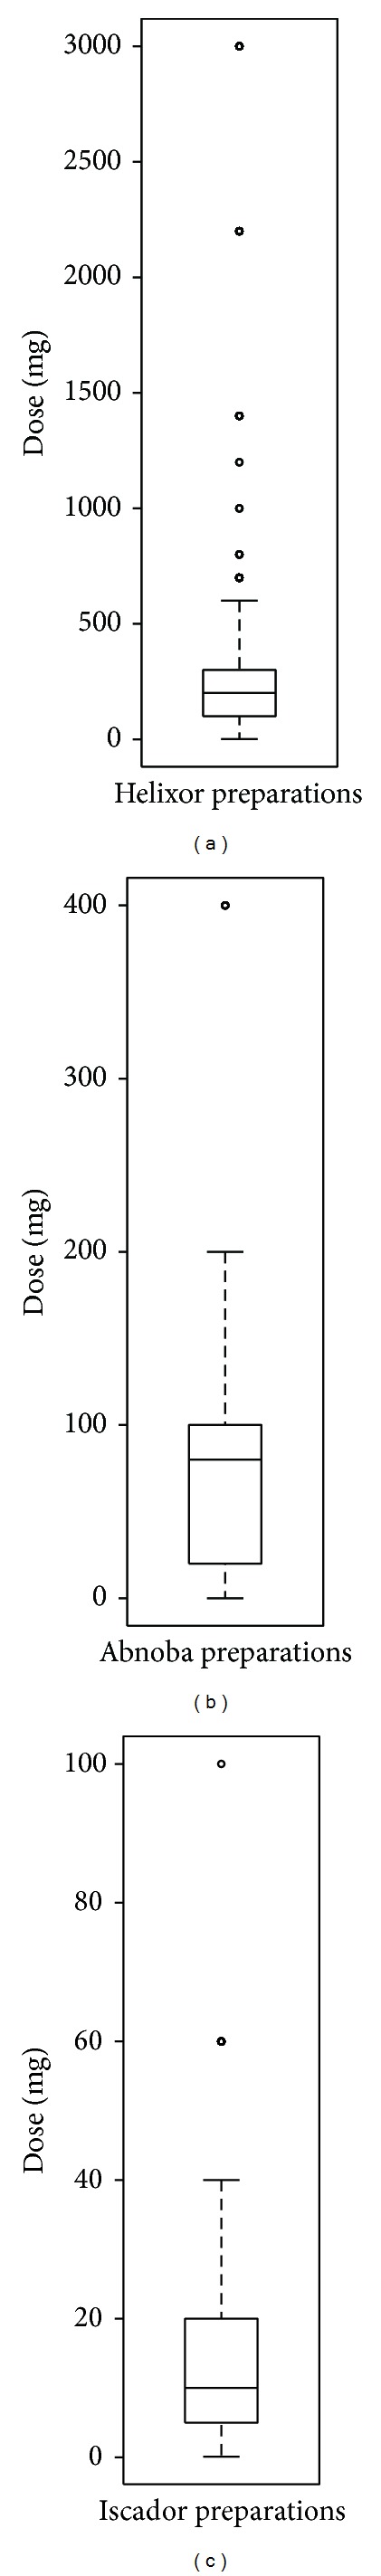
Doses at which intravenous mistletoe applications were given with respect to preparation type. Horizontal lines within boxes show median values, boxes show 25–75% data ranges, the whiskers extend by 1.5x the interquartile range, and circles represent outliers. Note the large differences in scale of the y-axes.