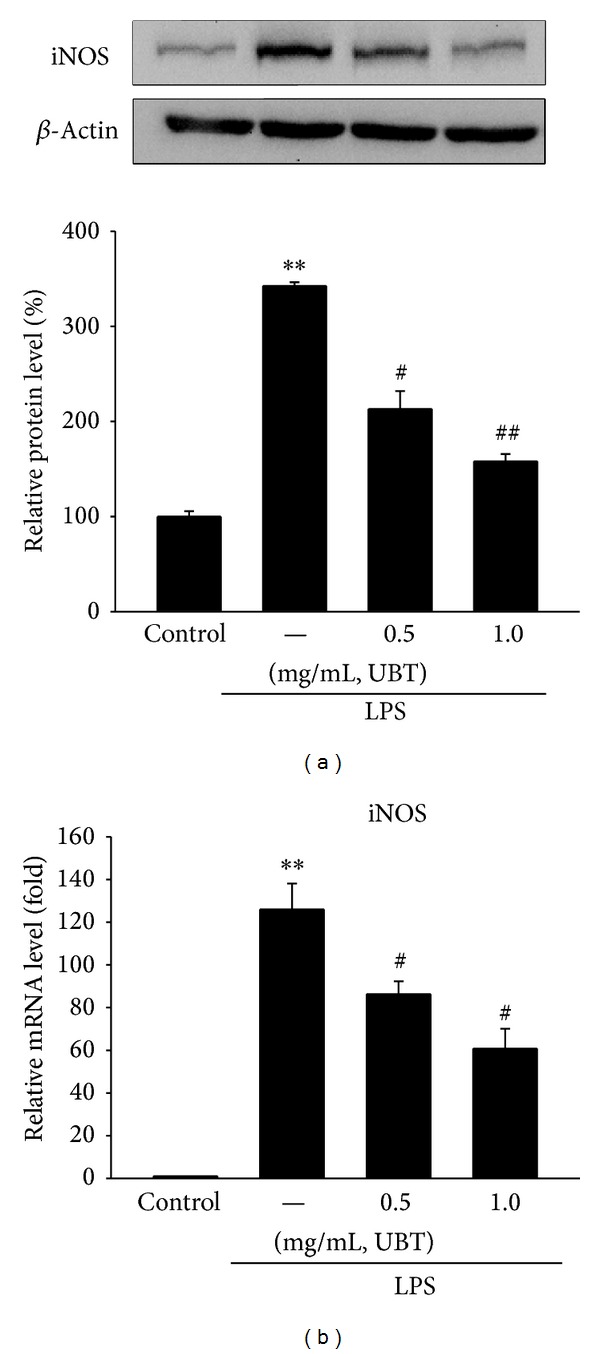
Figure 5.

Inhibition of LPS-inducible iNOS gene expression by UBT. (a) Representative iNOS immunoblottings. (b) Relative iNOS mRNA levels. The expressions of protein and mRNA were assessed 18 h after treatment with LPS + UBT. Data represents the mean ± S.E.M. from three experiments (significant as compared with control, **P < 0.01; significant as compared with LPS alone, # P < 0.05, ## P < 0.01). UBT, U-bang-haequi tang.
