Figure 6.

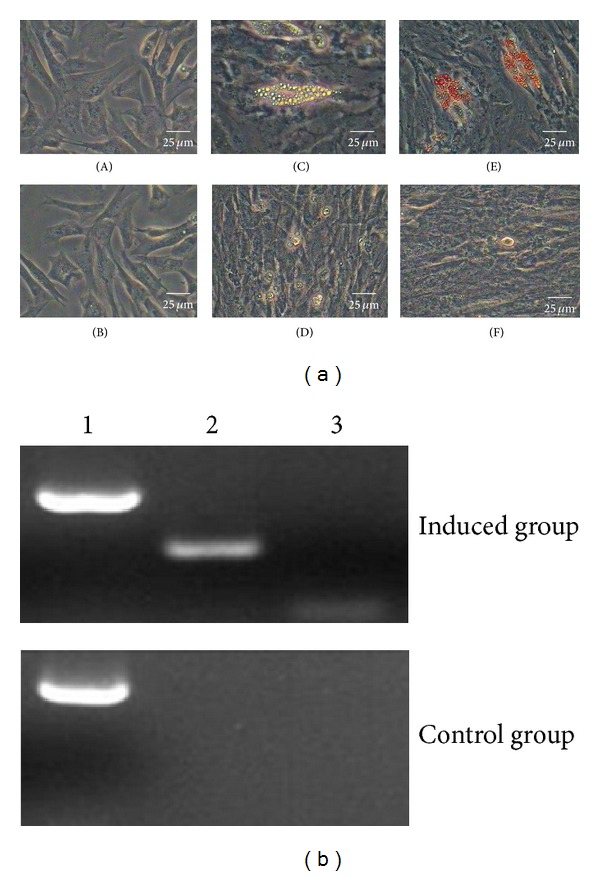
Adipogenic differentiation of DMS/PCs. (a) DMS/PCs morphology and staining detection of the induced group and the control group. ((B), (D), and (F)) The control group of adipogenic differentiation. After 1 d, 7 d, and 14 d, the cells cultured in complete medium had no difference in the morphology and phenotype and were also negative for oil red O staining. (A) DMS/PCs induced in the inducing culture medium after 1 d, and there is no difference in the morphology and phenotype. (C) The induced group of adipogenic differentiation. After induction for 7 days, the cell morphology began to change from a shuttle shape to an oblate shape, and many intracellular lipid droplets were present in the induced cells. (E) The cells of induced group were positive for oil red O staining (bar = 25 μm). (b) RT-PCR detection of the adipogenic markers LPL and PPAR-γ expression in induced group and control group. Induced cells were positive for LPL and PPAR-γ, but the control cells were not. 1: GAPDH; 2: LPL; 3: PPAR-γ.
