Figure 8.

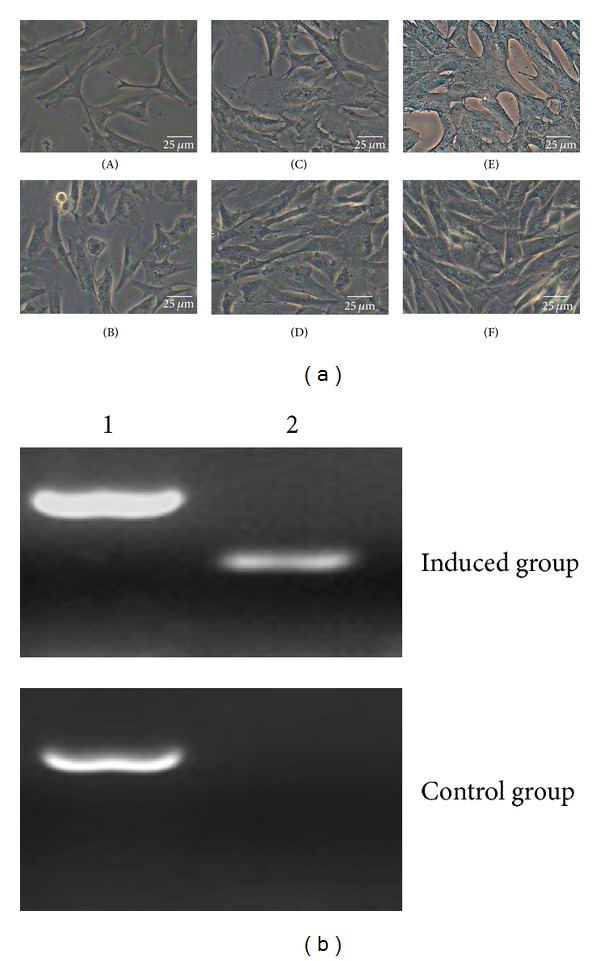
Cartilaginous differentiation of DMS/PCs. (a) DMS/PCs morphology and staining detection of the induced group and the control group. ((B), (D), and (F)) The control group of cartilaginous differentiation. Cells cultured in complete medium had no difference in the morphology and phenotype and were also negative for Alcian blue staining. (A) After 1 d, DMS/PCs in the induced group had no difference in the morphology and phenotype. (C) The induced group of cartilaginous differentiation. After induction for two weeks, the cells became compressed. (E) The cells of induced group were positive for Alcian blue staining (bar = 25 μm). (b) RT-PCR detection of the cartilaginous markers COLII expression in induced group and control group. Induced cells were positive for COLII, but the control cells were not. 1: GAPDH; 2: COLII.
